This page was last revised for version 5.0.9.
Please help us to keep up-to-date documentation by editing this page directly to fill in any documentation gap. Do reach out if you need assistance!
Overview
SNT’s Reconstruction Viewer is a 3D visualization tool for both surface meshes and skeletonized reconstructions of neurons. It can be used as a standalone program or from within SNT. Some of its features include:
- Interactive scenes (controlled rotations, panning, zoom, scaling, animation, dark/light theme)
- Support for axes, transparency, color interpolation, path smoothing, and geometric annotations (surfaces, meshes, vectors, planes, etc.)
- Tools for management and customization of scene elements
- Loading of surface meshes of several template brains (Drosophila, zebrafish, and mouse (Allen CCF))
- Render both local and remote files on the same scene
- Render scenes via GPU (the default), via CPU, or offscreen (headless)
- Generate scenes programmatically via scripting
")
")
Starting the Viewer
Reconstruction Viewer may be used as either a standalone program or from within SNT:
-
To open a standalone instance, press the “SNT” icon in the ImageJ toolbar and choose “Reconstruction Viewer” from the Neuroanatomy Shortcuts Window. This is the preferred way to visualize and quantify existing reconstructions.
-
To open the program from within SNT, use the “Open Reconstruction Viewer” option in the 3D tab of the SNT dialog. Note that for performance reasons some Path Manager changes may need to be synchronized manually from RV controls.
Scene Interaction
The display canvas supports multiple modes of interaction, including controlled rotations, panning, zoom, scaling, animation, and alternation between “dark” and “light” modes. Basic navigation controls include:
| Rotate |  Left Drag or ← Left → Right ↑ Up ↓ Down Left Drag or ← Left → Right ↑ Up ↓ Down |
| Pan |  Right Drag or ⇧ Shift + ← Left → Right ↑ Up ↓ Down Right Drag or ⇧ Shift + ← Left → Right ↑ Up ↓ Down |
| Zoom |  Mouse Wheel or + - Mouse Wheel or + - |
| Animate | Double Click |
| Snap to top/side view | ⌃ Ctrl + Left Click |
The full list of keyboard shortcuts is found by pressing the H (Help notification) or F1 (separate window), or by using the Scene Controls menu.
Reconstruction viewer is a generic visualization tool, supporting multiple species/animal models. Scenes are defined under Cartesian coordinates, not anatomical. As a consequence, the preset views obtained when control-clicking the scene correspond to XY, YZ, ZY planes, which may not reflect anatomical axes. E.g., the coronal view of the Allen reference brain for the adult mouse is mapped to YZ, which may seem unexpected.
RV Controls
The RV Controls dialog is the Reconstruction Viewer equivalent to the Path Manager in SNT’s tracing interface. It allows you to control and customize the objects displayed in the scene. Note that only interactive instance of the viewer display this dialog. Those generated programmatically via scripting may omit it. The dialog is organized as follows:
Scene Controls
This menu provides control over the rendered scene.

Fit to Visible Objects
Computes a bounding box containing all objects of the scene and adjusts the zoom level to ensure all objects are within the camera view. Shortcut: F
Fit to Selection
Zooms into the object(s) currently selected in the object list.
Viewer Size…
Allows fine-control over the viewer dimensions (useful for, e.g., resizing the viewer to known dimensions before recording an animation).
Full Screen
Enters full screen mode (⇧ Shift + F). To exit full screen press ⎋ Esc
Aspect Ratio/Scaling ›
Options to impose isotropic spacing by “squaring” the aspect ratio of the selected dimensions, leaving the others unchanged. Default is None (No imposition). This menu also includes a Stretch-to-Fill option that stretches the projection on the whole viewport. NB: This may distort proportions in the scene.
Axes ›
Controls for the Cartesian axes of the scene, including:
- Anatomical Mapping… Opens a dialog to assign anatomical labels and orientations to scene axes (e.g., Anterior–Posterior, Dorsal–Ventral, Left–Right), useful when working with registered data from reference atlases
- Axes Labels… Allows manual renaming of the X, Y, and Z axis labels
- Display Frame Toggles the full bounding frame (axis box) around the scene
- Toggle Axes Shows or hides the axis lines. Shortcut: A
- XY View: Flip Horizontal Axis / Flip Vertical Axis Flips the specified axis in the XY constrained view, which can be useful to mitigate mismatches between Cartesian and anatomical orientations (e.g., when left–right or dorsal–ventral conventions differ from the default rendering)
Scale Bar ›
Controls for an overlay scale bar rendered on the scene canvas:
- Display Scale Bar Toggles the scale bar overlay. When first enabled, a notification reminds the user of the assumed base unit
- Set Base Unit… Specifies the spatial unit of the scene coordinates (µm, nm, mm, or pixels). This determines how the scale bar length is computed and labeled
Toggle Dark Mode
Switches between dark and light theme. Shortcut: D
Reset View
Resets the view point, view mode, and zoom level, fitting and centering all scene objects into the camera view. Shortcut: R
Reload Scene
Resets the view and checks if all the drawables in the scene are being rendered properly. If not, allows the scene to be rebuilt completely. Shortcut: ⌃ Ctrl + R
Rebuild Scene…
Clears all objects from the scene then rebuilds them from scratch. Shortcut: ⌃ Ctrl + ⇧ Shift + R
Wipe Scene…
Removes all objects from the scene (this action is undoable).
Duplicate Scene
Stores the current scene into a new non-interactive instance of the viewer to allow side-by-side rendering of detailed scenes.
Sync Path Manager Changes
This option is only available when the viewer was initialized from SNT. It ensures any pending changes performed in the Path Manager percolate into the 3D scene. Shortcut: ⌃ Ctrl + ⇧ Shift + S
Neuronal Arbors
This menu relates to the import, customization and management of reconstructions and is organized into three sections.

Add Neuronal Arbors
Load File…
Imports and renders a single reconstruction file (“.swc”, “.traces”, “.ndf”, or “.json”).
Load Directory…
Imports and renders reconstruction files in a directory (filename pattern matching supported).
Load & Compare Groups
Allows import and rendering of groups of cells while performing morphometric comparisons between groups (including statistical reports and two-sample t-test/one-way ANOVA analysis). Color-coded montages of analyzed groups can also be generated. It is a modified alias for Utilities › Compare Reconstructions… in the tracing UI. See Comparing Reconstructions for details.
Load Demo(s)…
Loads demo subsets that can be open directly into the viewer.
Load From Database ›
Allows import and rendering of reconstruction files fetched from the FlyCircuit, InsectBrain, MouseLight, and NeuroMorpho remote databases.
Customize & Adjust Neuronal Arbors
This sections lists commands to modify the way reconstructions are displayed (colors, transparencies, etc.).
All Parameters…
Allows customization of color, transparency and thickness of neurites in a single dialog
Color…
Changes the (opaque) color of selected reconstructions.
Color Mapping ›
This menu includes commands that apply morphometric color mapping to selected reconstructions, so that a quantitative trait gets mapped to a color ramp (lookup table). Typically, such mapping will render reconstructions under a color gradient, with warmer hues depicting higher values of the mapped metric. It includes two options:
- Color Mapping › Individual Cells… Assigns color mappings to each cell independently in the ensemble of selected cells
- Color Mapping › Groups of Cells… Assigns color mappings using metrics retrieved for the ensemble of selected cells
Legends can be edited using Color Mapping Legends ›. This menu also includes commands to remove existing color mappings, and an option to assign unique (distinctive) colors to selected cell(s).
Thickness…
Specifies a constant thickness to be applied to the selected reconstructions. Confusingly, thickness is set using an arbitrary scale ranging from 1 (thinnest) to 8 (thickest).
Soma Radius…
Applies a constant radius (in physical units) to the soma(s) of selected reconstructions. Note that this requires nodes to be explicitly tagged as soma during import.
Translate…
Specifies a translation to be applied to selected reconstructions.
Remove Neuronal Arbors
This section of the menu includes commands for deleting reconstructions from the scene. Note that you can also remove objects using the contextual menu.
3D Meshes
This menu includes commands for loading, managing, and customizing 3D meshes commonly used to represent surface meshes of anatomical structures, neuropil labels, or brain compartments. Currently only Wavefront OBJ files are supported. It is also organized in three sections:

Load OBJ File(s)…
Includes commands for import and rendering of Wavefront OBJ files, or folders containing multiple files.
Customize Meshes
Includes commands for adjustment of the color and transparency of the selected mesh(es) and/or their computed bounding boxes, including color, transparency (as percentage), visibility of bounding box, etc.
Remove 3D Meshes
This section of the menu includes commands for deleting meshes from the scene. Note that you can also remove objects using the contextual menu.
Geometric Annotations
This menu includes commands for handling geometric annotations such as points, vectors, surface, and cross-section planes.

Add Annotations
Commands for adding cross-section planes, surfaces, as well as simpler primitives (spheres, vectors, and planes). Annotations can be split in three categories:
Cross-section planes
Cross-section planes can be cell-based or mesh-based:
- Tree-based: Cross-section planes can be rendered in either X,Y,Z axis along the centroid (mid-plane) of either dendrites, or axons, or at the center of cell soma
- Mesh-based: Cross-section planes can be rendered in either X,Y,Z axis along the centroid (mid-plane) of the mesh
Surfaces
Similarly to convex hulls, surfaces reflect enclosing polyhedrons. Surfaces can also be of two types:
- Tree-based: Cell-based surfaces can be assembled from the point cloud defined by branch-points or tips of a neuronal arbor
- Mesh-based: Mesh-based surfaces can be assembled from the point cloud of the mesh’s vertices associated with either the left or the right hemisphere (bilaterians model organisms)
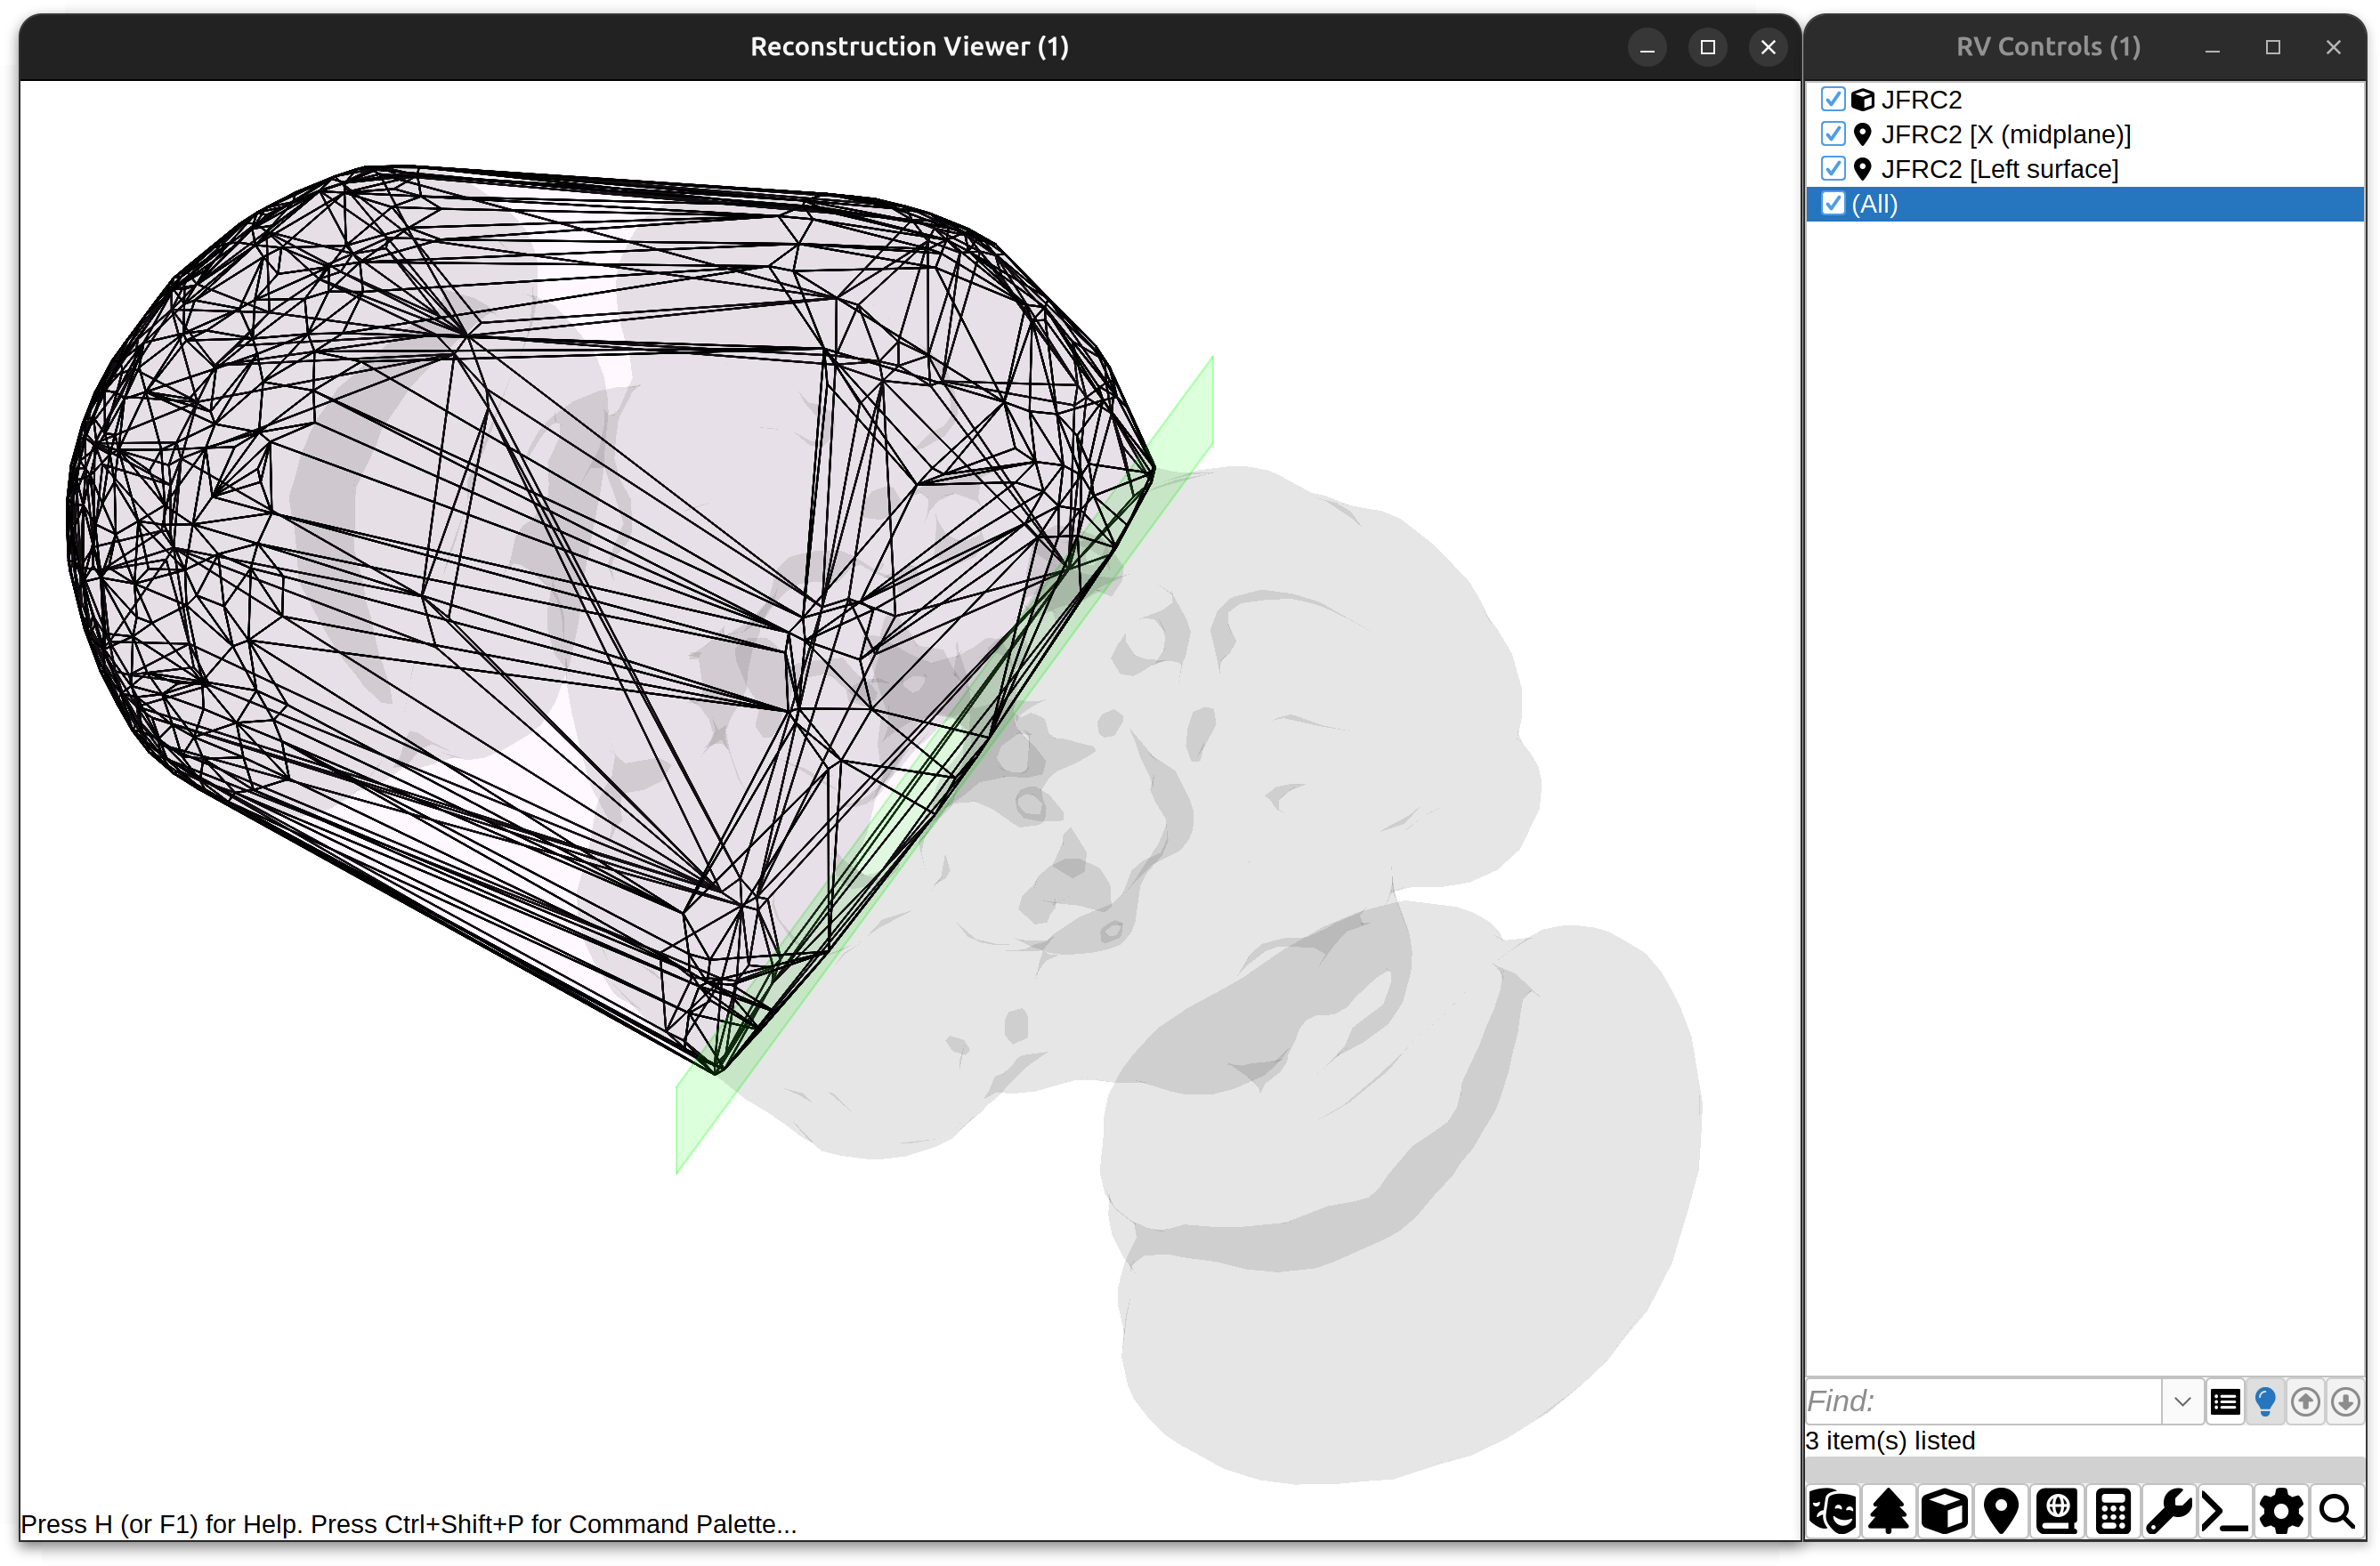
Geometric annotations: Surfaces and planes
Shapes
These are 3D primitives including, parallelograms, spheres, or vectors at specified coordinates.
Customize Annotations
This section contains commands to modify the color, transparency, etc. of annotations, as well as more advanced options, including:
- Color Gradient: Display the annotation under a hue gradient along a specified axis. NB: Transparency levels of color gradients may not be adjustable
- Surface Rendering: Adjusts the ambient, diffuse, and specular lighting model of objects. This option is only available for simple 3D primitives such as spheres and vectors
Remove Annotations
This section of the menu includes commands for deleting annotations from the scene. Note that you can also remove objects using the contextual menu.
Reference Brains
 This menu allows import of neuropil meshes for Drosophila, zebrafish, and mouse. Several reference brains and anatomical compartments are available either locally (offline) or through direct download (internet connection required).
The menu is organized by animal model:
-
Mouse (Allen CCF Navigator): Import and navigation system for the Allen Adult Mouse Common Coordinate Framework (CCF). The Navigator automatically loads the CCF outline mesh, and presents a searchable hierarchy of CCF(v3) ontologies that can be downloaded into the scene.
For further details:
-
Zebrafish: Offline access to the Max Planck Zebrafish Brain Atlas template
-
Drosophila: Support for multiple neuropils:
- Templates for adult brain (e.g., FCWB, JRC 2018 unisex brain template, JFRC2, JFRC3) and Ventral Nerve Cord (JRC 2018 unisex VNC)
- Larval stages, including 1st (L1) and 3rd instar (L3)
For further details:
Analyze & Measure
 This menu houses commands to measure and analyze loaded reconstructions. Most are described in Analysis.
Tabular Results
Includes two commands:
- Measure… Provides a comprehensive selection of measurements to be extracted from selected cells. See Analysis › Measurements for details
- Quick Measurements… Convenience shortcut for running Measure… with common metrics
Distribution Analysis
Includes two commands:
- Branch Properties… Measures all branches of the currently selected reconstructions (without considering cell identity) and plots frequencies of the chosen metric. Enabling quantification of branch properties across a population.
- Cell Properties… Plots frequencies of single-cell measurements.
Specialized Analysis
Convex Hull…
Computes and displays the convex hull of a reconstruction (i.e., the smallest convex polygon/polyhedron that contains a neuronal arbor). Convex hull measurements are defined in Metrics. Note that it is also possible to define polyhedron based on subsets of nodes (e.g., branch points) using surface annotations.
Create Dendrogram
Generates a Dendrogram plot of single cells. See Graph-based Analysis.
Persistent Homology…
See Analysis › Persistent Homology.
Sholl Analysis…
Runs Sholl Analysis on single cells.
Strahler Analysis…
Conducts Strahler Analysis on single cells.
](/media/plugins/snt/snt-combined-histograms.png)
](/media/plugins/snt/snt-recviewer-convexhull-and-surface.png)
](/media/plugins/snt/graph-viewer-dendrogram-simple.png)
](/media/plugins/snt/sholl-analysis-outputs.png)
](/media/plugins/snt/strahler-analysis-from-reconstructions.png)
](/media/plugins/snt/sankey-flow-plot-with-tooltip.png)
](/media/plugins/snt/snt-brain-analysis-ipsi-contra.png)
Atlas-based Analyses
Annotation Graph
 Creates annotation graphs (e.g., Ferris wheel and Flow (Sankey) diagrams) from one or more cells. See Analysis › Annotation Graphs for details.
Brain Area Frequencies
Measures the amount of cable length, number of terminal nodes, or both that occur in distinct anatomical regions of the brain, with the option to restrict the analysis up to a maximum depth in the ontology hierarchy. See Analysis › Brain Area Frequencies for details.
Data Export
Allows saving of any tabular measurements and plots generated by analysis commands. Tables are saved as Comma-separated values, while plots are saved as images. Note that individual plots can be exported to PDF/SVG using the plot’s contextual menu.
Utilities & Actions

Utilities
Annotation Label…
Adds a text label with options to customize font size, style, color, rotation angle, and location.
Color Mapping Legends ›
Contains options to add, edit, or remove Color Mapping legends.
Light Controls…
Adjustments of light and shadows. Note these are currently experimental features.
Create Figure…
Only available in standalone viewers. See Manual › Create Figure….
Record Animation…
Animates a rotation of the current scene and saves each frame to disk. The save directory, rotation degree, duration and frames per second may be adjusted in Preferences.
Snapshots
Commands for handling scene snapshots, including:
- Take Snapshot & Display Takes a snapshot of the current scene and displays it in ImageJ
- Take Snapshot & Save to Disk Saves a PNG image of the current scene to disk. The default directory may be changed in Preferences. Snapshot: S
- Show Snapshot Directory Opens the snapshot export directory in the native file explorer
Scripting
Commands to create scripts, including:

- Record Script… Starts the Script Recorder. Shortcut: [
- Log Scene Details to Recorder Logs detailed information about the current scene (e.g., currently visible objects, API calls, etc.) to the Console. This facilitates programmatic control over the Viewer’s scene, since logged info can be used directly in scripts. Shortcut: L
Settings
Options and global settings. It is divided in 4 sections:

Layout
Includes options to toggle the visibility of the RV Controls dialog (typically hidden in full screen). Shortcut: ⇧ Shift + C
Keyboard & Mouse Sensitivity
This section contains options for sensitivity of mouse and keyboard scene interaction. Note that a default shared sensitivity parameter can be specified for panning, zooming and rotating (using hotkeys) in the Global Preferences… dialog, including
- Pan Accuracy › Sets the responsiveness of panning. A lower step size is more responsive
- Zoom Steps (+/- Keys) › Sets the percentage of a single zoom step via + - keys
- Rotation Steps (Arrow Keys) › Sets the number of degrees of a single rotation step via ← Left → Right keys
- Animation Type › Sets how the scene animates when a rotation is triggered (double-click or recorded animation). Full Rotation performs a continuous 360° sweep, while Ping-pong oscillates back and forth over a fixed arc (~60°). The preference persists across sessions
Neurite Rendering
This section contains options that control how neuronal arbors are drawn:
- Neurite Style Selects the rendering mode for neurite paths (mutually exclusive):
- Simple Lines Basic line rendering (default, fastest)
- Pseudo-Lighting Modulates neurite brightness based on orientation relative to the camera, giving a sense of depth without full 3D geometry
- Shaded Tubes Renders neurites as illuminated 3D tubes using per-fragment Phong lighting (requires OpenGL 3.2+)
- Shaded Tubes (Wireframe) Same as Shaded Tubes but with a wireframe overlay showing mesh edges
An additional Tube Sides… option sets the number of sides for tube cross-sections (higher values produce smoother tubes at the cost of performance)
-
Path Smoothing Applies Catmull-Rom spline interpolation to reduce angular kinks at thick line joints. Options: None, Low, Medium, High (corresponding to upsampling factors of 1, 2, 4, and 8, respectively)
- Depth Perception Fades distant neurites toward the background color to enhance depth cues. Intensity presets include Subtle, Moderate, Strong, and Full, or depth fog can be disabled entirely with None
Mesh Rendering
Options controlling how surface meshes (OBJ files) are rendered:
- Mesh Style Selects the shading mode for meshes (mutually exclusive):
- Default Fixed-function rendering (jzy3d default pipeline)
- Smooth Shading Per-fragment Phong lighting with hemispherical ambient, producing smoother surfaces
- Backface Culling Skips back-facing triangles during rendering. This improves performance for closed (watertight) meshes but may cause visual artifacts on open surfaces
Advanced Settings
Includes advanced controls such as:
- Debug Mode Logs detailed information about commands usage, including warnings and errors to the Console
- Enable Hardware Acceleration Sets hardware accelerated 3D graphics
Other
Sets persisting preferences for snapshot recordings, keyboard and mouse controls, and the preferred scripting language for the Viewer. Persistent preferences apply across viewers and sessions.
Command Palette
Triggered by ⌃ Ctrl / ⌘ ⌃ Ctrl on a PC ⌘ command on a Mac + ⇧ Shift + P. See User Manual › Command Palette.
Contextual Menu

Lists commands to select, show, or hide objects and their components (e.g., Show Soma of Selected Trees, or Hide Bounding Box of Selected Meshes), as well as other utilities. Noteworthy:
Add Tag(s)
Adds one or more tags (space or comma-separated list) to selected items. Tags encoding a color (e.g., ‘red’, ‘lightblue’, or ‘#FFB300’) are used to highlight entries. Note that it is also possible to double-click on an object to edit its tags. Shortcut: ⌃ Ctrl / ⌘ ⌃ Ctrl on a PC ⌘ command on a Mac + ⇧ Shift + T
Apply Scene-based Tags
Tags selected entries with their respective rendering colors. Assumes selected objects are monochromatic.
Label Categories
Tags listed entry with the icon corresponding to their type (reconstruction, annotation, or mesh).
Sort List
Sorts the list alphabetically.
Toggle Selection Toolbar

Allows objects to be searched and filtered, functioning similarly to Path Manager’s Filter Toolbar. Shortcut: ⌃ Ctrl / ⌘ ⌃ Ctrl on a PC ⌘ command on a Mac + F
Advanced Scenes
Advanced scenes are generated via scripting. The Render collection of template scripts demonstrates how to use the viewer in headless mode, and how to generate programmatic scenes.