The content of this page has not been vetted since shifting away from MediaWiki. If you’d like to help, check out the how to help guide!
|
|
|
| Software | IJPB-plugins |
| Source |
Introduction
 Similar to the Marker-controlled Watershed plugin, this ImageJ/Fiji plugin segments grayscale images of any type (8, 16 and 32-bit) in 2D and 3D using the marker-controlled watershed algorithm by Meyer and Beucher (1990) and it floods the image from specific seed points, but this time the points are introduced interactively by the user.
Usage
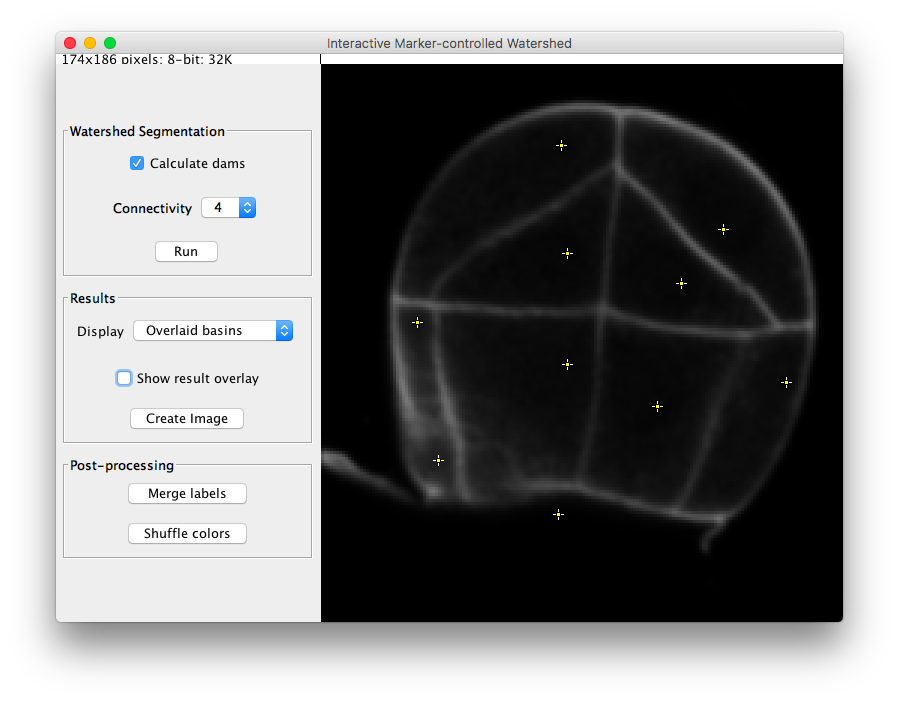
Interactive Marker-controlled Watershed runs on any open grayscale image, single 2D image or (3D) stack. If no image is open when calling the plugin, an Open dialog will pop up.
The user can pan, zoom in and out, or scroll between slices (if the input image is a stack) in the main canvas as if it were any other ImageJ window. On the left side of the canvas there are three panels of parameters, one with the watershed parameters, one for the output (result) options and one for post-processing the result. All buttons, checkboxes and panels contain a short explanation of their functionality that is displayed when the cursor lingers over them.
Interactive markers
In this plugin the markers are introduced interactively by the user using any of the selection tools. By default, the point selection tool will be enabled in the main ImageJ toolbar. To select markers on different slices, one option is to use the point selection tool and keep the SHIFT key pressed each time you click to set a new marker. Another possibility is to use the ROI Manager. In that case, all selected ROIs in the manager will be used as markers
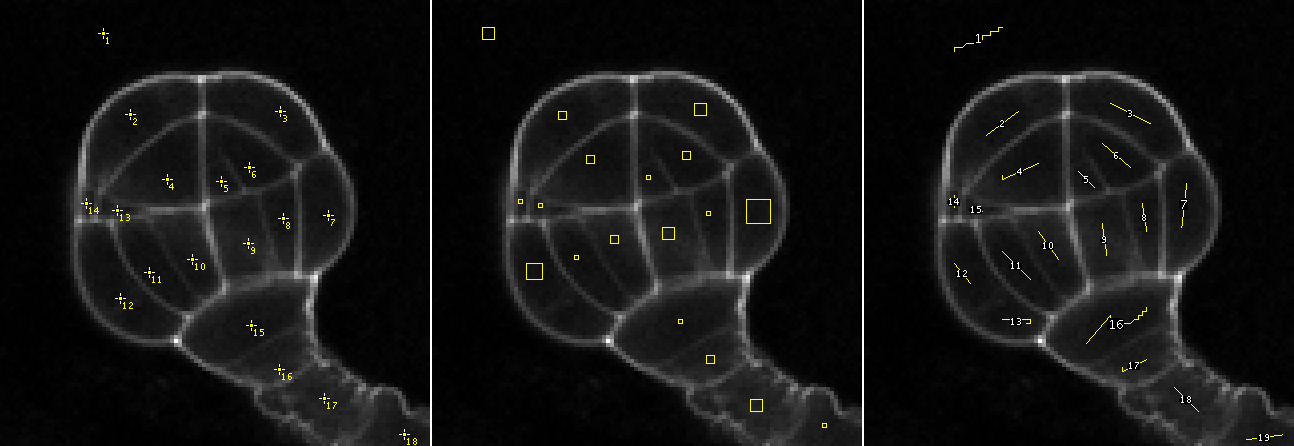 Examples of ROIs used as markers by the plugin.
Watershed Segmentation panel
 This panel is reserved to the parameters involved in the segmentation pipeline:
- Calculate dams: un-check this option to produce segmentations without watershed lines.
- Connectivity: voxel connectivity (4-8 in 2D, and 6-26 in 3D). Selecting non-diagonal connectivity (4 or 6) usually provides more rounded objects.
Finally, click on “Run” to launch the segmentation. If your segmentation is taking too long or you want to stop it for any reason, you can do so by clicking on the same button (which should read “STOP” during that process).
Results panel
 Only enabled after running the segmentation.
- Display: list of options to display the segmentation results.
- Overlaid basins: colored objects overlaying the input image (with or without dams depending on the selected option in the Watershed Segmentation panel).
- Overlaid dams: overlay the watershed dams in red on top of the input image (only works if “Calculate dams” is checked).
- Catchment basins: colored objects.
- Watershed lines: binary image showing the watershed lines in black and the objects in white (only works if “Calculate dams” is checked).
- Show result overlay: toggle result overlay.
- Create image button: create a new image with the results displayed in the canvas.
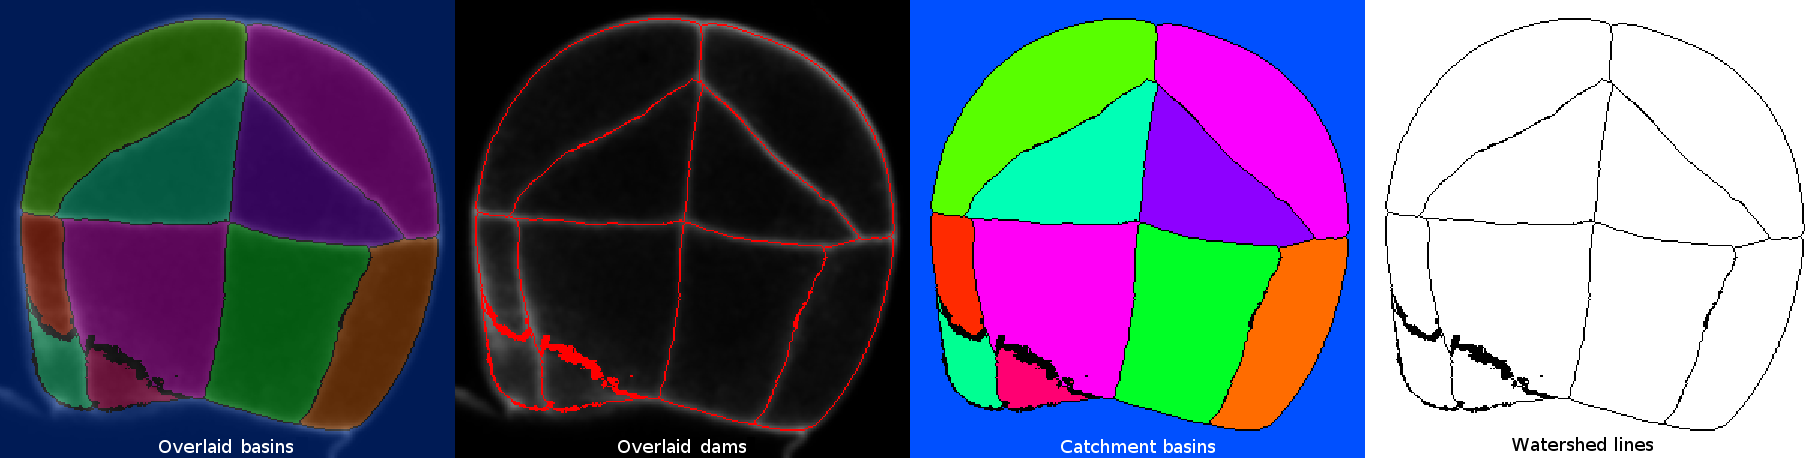 Examples of the 4 different display options.
Post-processing panel
 Similarly to the Results panel, this panel only gets enabled after running the segmentation pipeline.
- Merge labels: merge together labels selected by either the “freehand” selection tool (on a single slice) or the point tool (on single or multiple slices). The zero-value label belongs to the watershed dams, therefore it will ignored in case of being selected. The first selected label value will be assigned to the rest of selected labels, which will share its color.
To select labels on different slices, use the point selection tool and keep the SHIFT key pressed each time you click on a new label.
- Shuffle colors: randomly re-assign colors to the labels. This is a very handy option whenever two adjacent labels present a similar color.
Installation
The Marker-controlled Watershed plugin is part of the MorphoLibJ library. To install it, you just need to add the IJPB-plugins update site:
1) Select Help › Update… from the Fiji menu to start the updater.
2) Click on Manage update sites. This brings up a dialog where you can activate additional update sites.
3) Activate the IJPB-plugins update site and close the dialog. Now you should see an additional jar file for download.
4) Click Apply changes and restart Fiji.
You should now find the plugin under the sub-menu Plugins › MorphoLibJ › Segmentation.
Note: Marker-controlled Watershed is only one of the plugins included in the MorphoLibJ suite. By following these installation steps, you will be installing as well the rest of plugins in the suite.
References
- Fernand Meyer and Serge Beucher. “Morphological segmentation.” Journal of visual communication and image representation 1.1 (1990): 21-46.
- Soille, P., “Morphological Image Analysis: Principles and Applications”, Springer-Verlag, 1999, pp. 170-171.
- David Legland, Ignacio Arganda-Carreras, Philippe Andrey; MorphoLibJ: integrated library and plugins for mathematical morphology with ImageJ. Bioinformatics 2016; 32 (22): 3532-3534. doi: 10.1093/bioinformatics/btw413
See also
- Morphological Segmentation, a plugin with a graphical user interface to segment 2D/3D images based on morphological operations and the watershed algorithm.
- Classic Watershed, plugin implementing the original watershed algorithm to segment 2D/3D grayscale images.
- Serge Beucher’s site, with graphic descriptions and animations of the watershed algorithms.
- G. Bertrand’s Topological Watershed site, with papers, lecture slides and source code.
License
This program is free software; you can redistribute it and/or modify it under the terms of the GNU General Public License as published by the Free Software Foundation (http://www.gnu.org/licenses/gpl.txt).
This program is distributed in the hope that it will be useful, but WITHOUT ANY WARRANTY; without even the implied warranty of MERCHANTABILITY or FITNESS FOR A PARTICULAR PURPOSE. See the GNU General Public License for more details.