The content of this page has not been vetted since shifting away from MediaWiki. If you’d like to help, check out the how to help guide!
|
|
|
| Source | |
| Category |
Techniques |
ImageJ/Fiji plugin to to analyze Scanning Angle Interference Microscope Data.
Installation
To install this plugin check the “ValelabUtils” update site in the Fiji updater. Please note that the plugin was updated 1/28/2026 to version 1.10.0 to work with recent Fiji versions.
Description
SAIM (Scanning Angle Interference Microscopy) is a technique to measure the distance of fluorescent dyes to the surface at nm resolution. To use it, one needs to place the sample on a silicon chip (that acts as a mirror) with a solicon oxide (glass) spacer). The reflection of coherent excitation light will interfere with the incoming beam and set up a standing wave pattern, resulting in fluorescence intensity that varies with distance to the surface. By varying the angle of incidence, the standing wave pattern changes in predictable ways, and a series of images at different angles can be used to deduce the height of fluorescence molecules, independent of their intensity. This technique is very well described by Paszek et al., and this plugin uses the equations from the Paszek et al. paper with a few SAIM Math.pdf extensions. A thorough description can be found in our manuscript or in the preprint version on BiorXiv. . If you use this plugin, please do cite that paper.
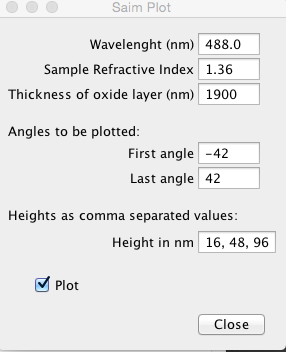
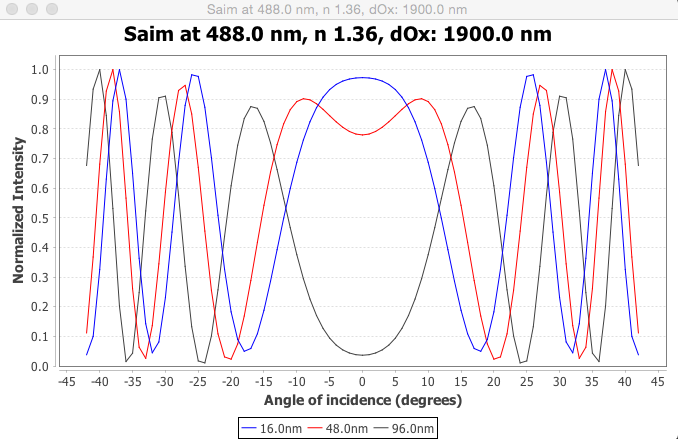
This plugin consists of three parts. “Saim Plot” plots theoretical predictions for the intensity distribution as a function of height.
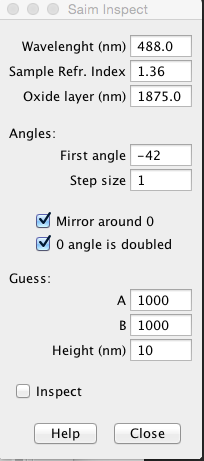
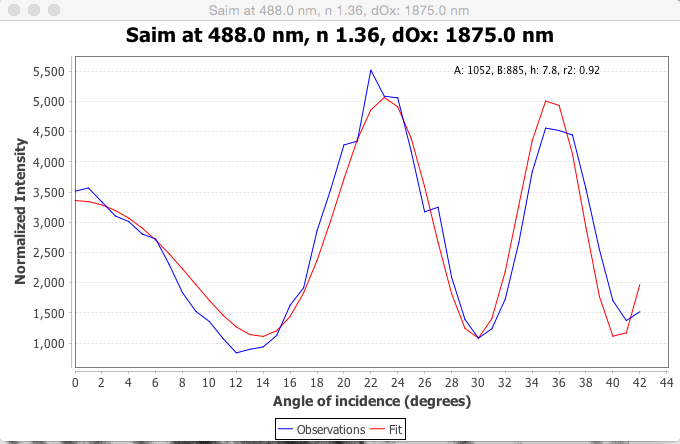
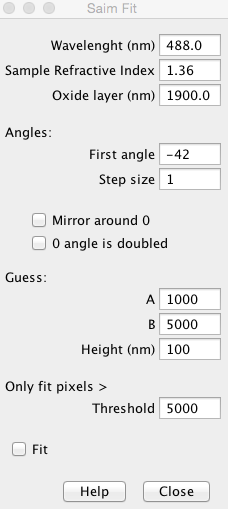
“Saim Inspect” and “Saim Fit” are very similar, however, Saim Inspect will act on the average values of the ROI (for instance, the pixel under the cursor) and executes only a single fit, whereas Saim Fit will analyze all pixels of the image stack. You will likely want to play with Saim Inspect first and determine reasonable guesses for A, B, and height. Note that you can fit with multiple guesses for the height (enter these as comma values, i.e. “50.0, 200.0, 350.0”), which is needed when the heights in your image span more than ~150nm. Use Saim Inspect to establish best guesses for A, B, and height (starting with a guess that is close to the final value will decrease the computation time).
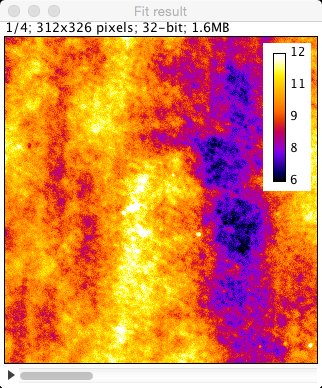
Saim Fit will fit each pixel in the input stack and output a stack with 4 images, the first one is the height map (in nm), the second image has the r-squared values (an indication of the goodness of fit with values between 0 and 1, the closer to 1, the better the fit), the third image shows the values for “A”, and the last image the values for “B”. Saim Fit will use as many thread as you allow in Edit › Options › Memory & Threads and it is best to set that value to the number of cores in your computer. If there is significant movement while taking the stack, you will first need to “de-jitter” using another ImageJ plugin (such as StackReg). The output image will have the Fire LUT by default. Do note the “Thresholding” parameter. Only pixels that are higher in intensity than the threshold will be analyzed. This can greatly reduce the analysis time (“dark” pixels will be hard to fit and are usually uninteresting anyways).
Usage in a macro
To call the Saim analysis code in a macro, use the “Fit_Macro” plugin. Macros can look like:
run(“Fit_Macro”, “wavelength=488 sample=1.32 oxide=1900 first=-42 step=1 a=3 heights=28.0 “);
Example Data
These datasets were obtained by imaging a phospho-lipid bilayer stained with DiO (488), DiI(561), and DiD(640nm) (data acquired by Kate Carbone). The parameters shown below were used for analysis.


Some of the single pixels fits we obtained look as follows:
History
- 1.10.0 (2026-01-28): Updated dependencies to work with recent Fiji versions (all issues due to JFreeChart)
- 1.0.8 (2016-09-28): Added Fit_Macro, a blocking version of the Fit plugin that can be called from a macro
- 1.0.7 (2016-04-22): Fixed bug that caused most pixels not to be fit
- 1.0.6 (2016-04-21): Added capability to export data and predictions from Inspect module.
- 1.0.5 (2016-04-05): Most settings are now shared between all 3 plugins and are remembered. Multiple start heights can now be entered in the fit module and the resulting fit with the lowest error will be reported.
- 1.0.4 (2016-4-05): Multiple heights can be entered in Inspect as a comma separated list. They will also be used to fit against the data and the best fit will be reported.
- 1.0.2 (2016-01-22): Added capability to export predicted data from Plot module
- 1.0.1 (2016-01-12): Changed calculation of rTE to what appears to be the correct formula