This page describes a detector for TrackMate that creates objects from a label image image.
Usage
Label images are especially convenient as an output of segmentation algorithms. Indeed, in some cases you might have different objects that are so close that they touch each other. If a segmentation algorithm can detect them, but outputs a black and white mask, they will appear as one object in the mask if they share a border. In a label image, each object is represented by different integer values. For instance, the object #1 in a label image will be made from all the pixels that have a pixel value of 1, over a black background of 0. Object #2 will have the pixel value 2, etc. This allows resolving them even if they touch each other.
You can use a label image as a channel in your source image, since TrackMate can harness multi-channel image. The image types does not have to be of integer type; but the labels need to be integers even on a float type. This makes it easier to combine the label image with the raw image.
If you have only one channel the preview look like this:
Step-by-step tutorial
First download the tutorial dataset on Zenodo:
![]()
- Open Fiji.
- Open your image in Fiji.
- Open TrackMate Plugins › Tracking › TrackMate. The start panel will open and display information about your image dimensions. Click
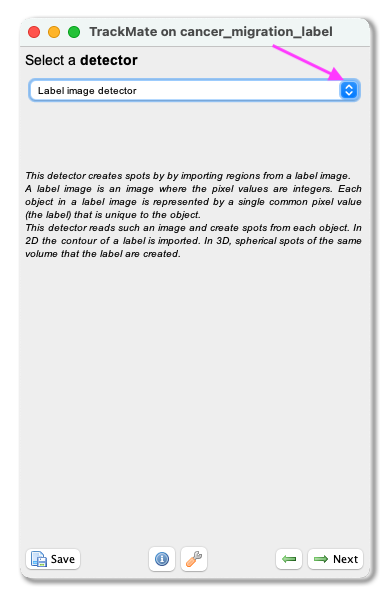
Next. - The “Select a detector” -panel opens. From the pull-down menu select the Label Image detector. Click
Next.
-
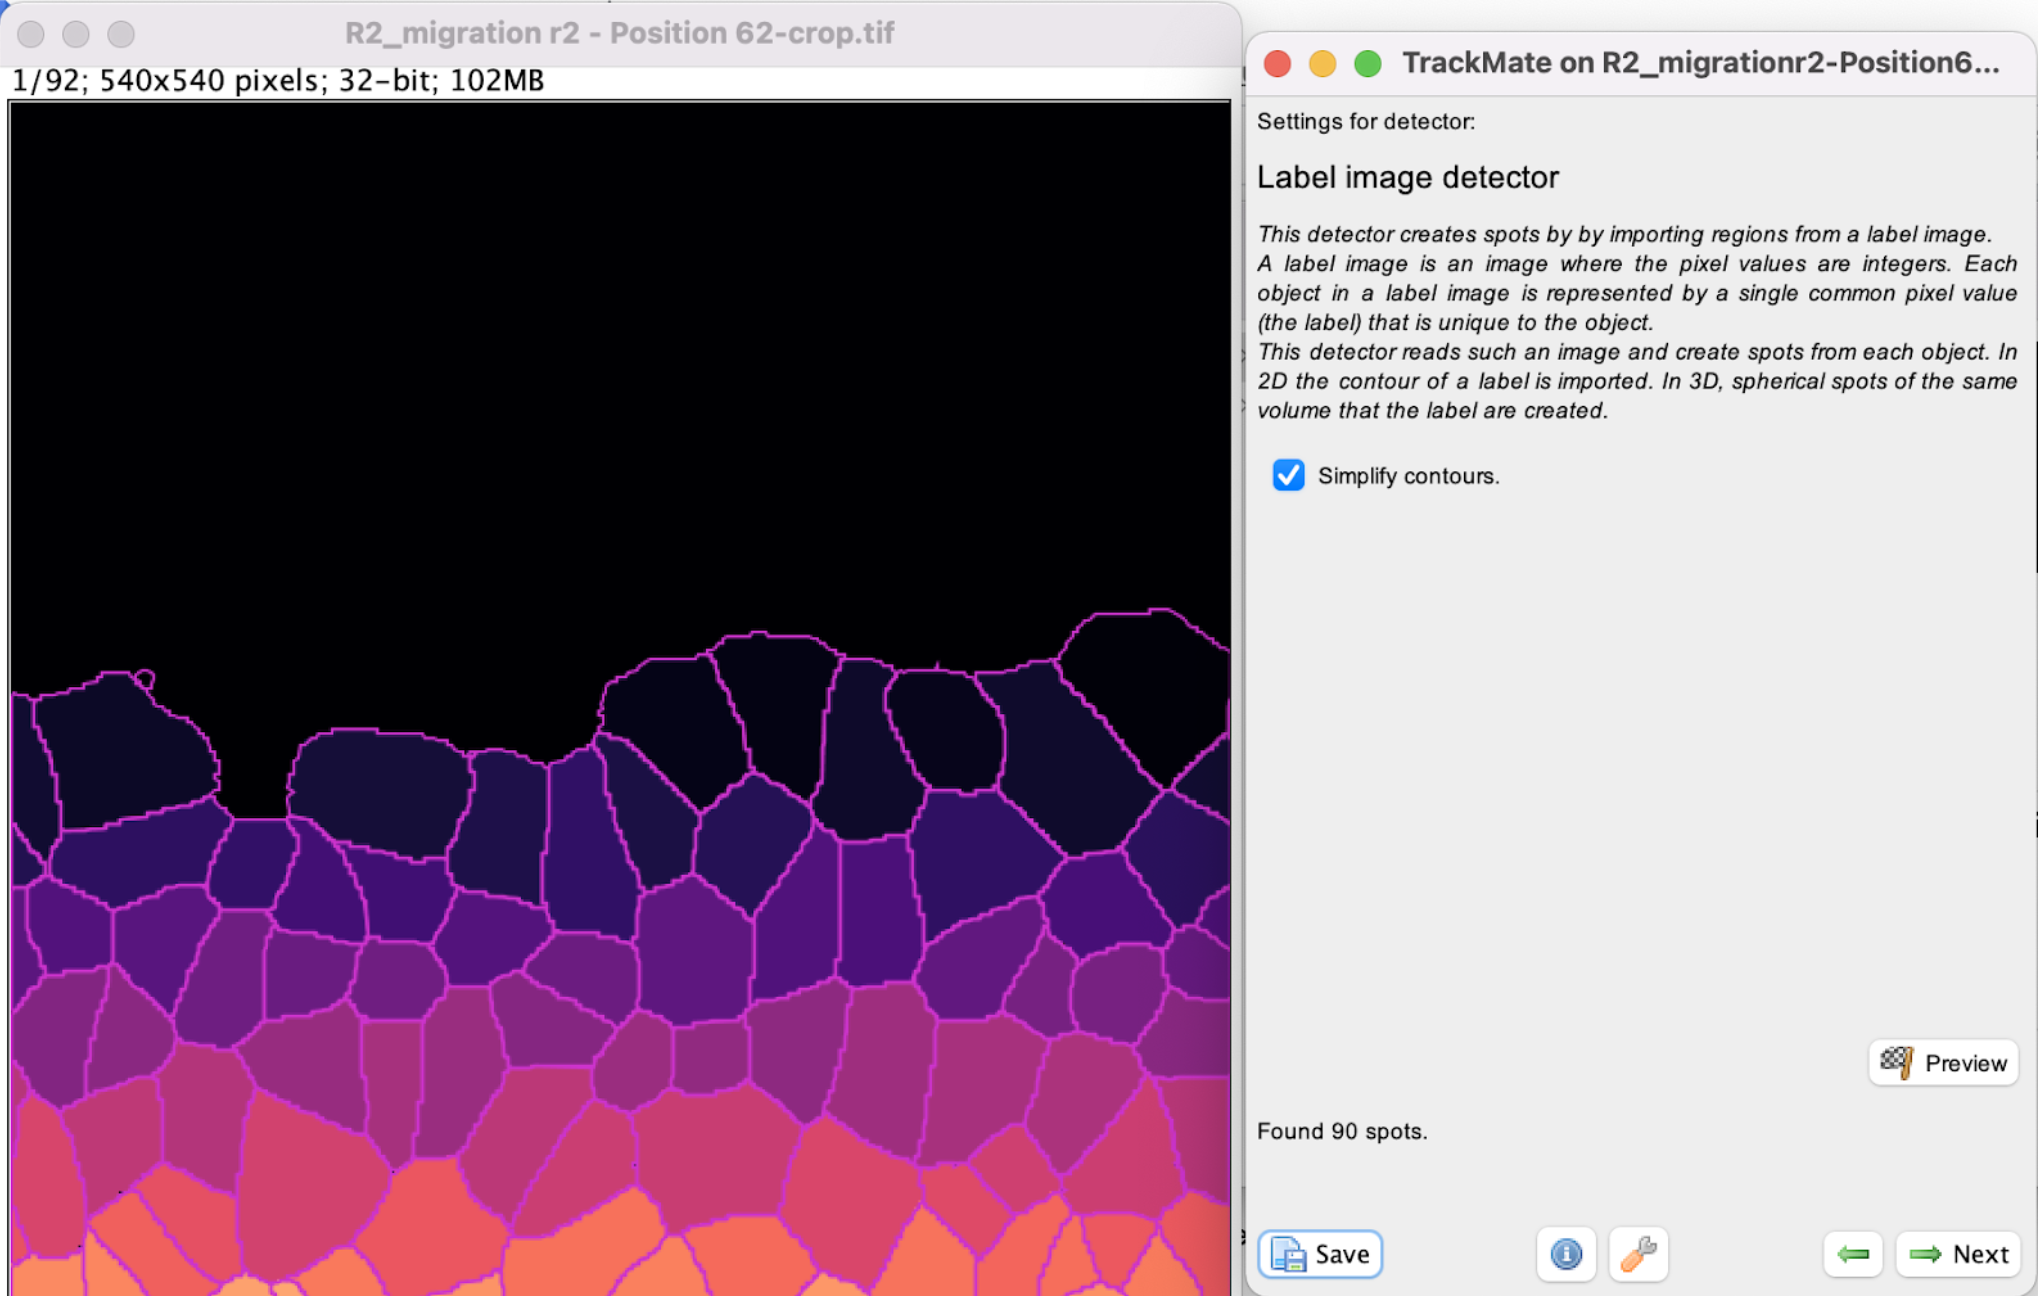
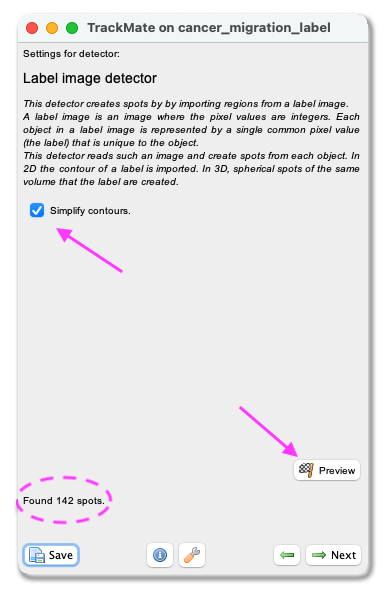
A panel with the description of the detector opens. Here you can also select to Simplify the contours to smooth the edges of the segmented objects. Click on
Previewto see a preview of the segmentation. On the left, there will also be the number of detected objects in that field of view. ClickNext. The objects are now being detected. -
When the progress bar has reached the end, click
Next.
-
A panel to filter the detected spots according to their quality opens (more information about this filtering can be found here). With our test image, this part can be ignored. Click
Next. -
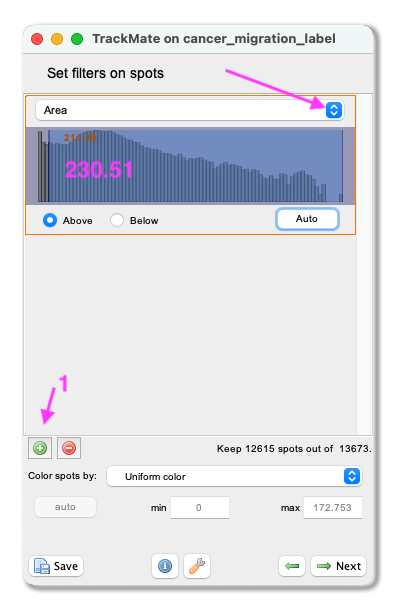
A panel to filter spots according to their properties (i.e. size, shape, location, or signal intensity) opens. With our test image, in frame 65 you will see small floating cells that were segmented. To get rid of this, you can add a spot filter to remove anything with an
Arealower than 230. ClickNext.
- A tracking panel opens. In this panel, you can select a method for tracking your objects. In this exercise, we use the
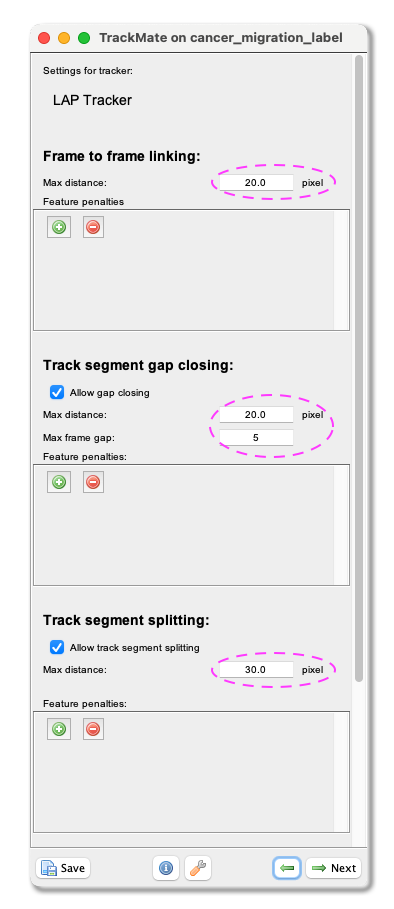
LAP tracker. Please select it from the pull-down menu, and clickNext. - A panel for the LAP tracker settings opens. First, with the
Frame to Frame linkingparameter, you give the maximum distance to link two objects between frames. With our test image, we used 20 microns. Then, you can choose how many spots can be missing, and they could still be the same track. Tick theAllow gap closingbox and add values:Max distance: 20 microns andMax frame gap: 5. Next, you let TrackMate know if the tracks are allowed to split. Splitting can be caused, for example, due to cell division. Tick the boxAllow track segment splittingand insert value Max distance: 30 microns. Below you will also see settings for Track segment merging. Here this box should remain unticked. ClickNext. - A Track filter panel opens. In this panel, you can filter tracks according to their properties (i.e., length, speed, or location). With our test image, we do not need to filter any tracks. Click
Next.
-
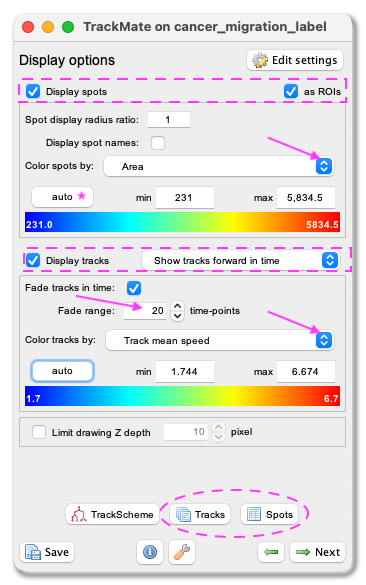
A panel with the Display options appears. Here you can define how the objects and tracks are labelled.
- First make sure that the
Display spots,as ROIsandDisplay tracksboxes are ticked. - Select from the pull-down menu
Color spots by Area, and clickauto. This allows you to visualise cell size by color (blue smaller cells, red the largest). - From the pull-down menu, select
Show tracks forward in time. This will show the future trajectories of the tracked objects. -
from the Color tracks by pull-down menu select
Track mean speed. And clickauto. - Click
Next.
-
In this panel you can also export the results as .csv files, please do so by clicking
Tracksat the bottom of the panel. A window with a lot of data shows up. Make sure you export theSpots(information about the spot) and theTracks(information about the tracks) files. Close the results window and clickNext. You will see a plot features panel - again clickNext. You will see a plot features panel, where you can generate plots of certain features if you wish - again clickNext. - In the last panel, there is a possibility to do different actions. For this exercise, we will export a tracking image of our experiment. From the pull-down menu please select
Capture overlay. As you clickExecutebelow a pop-up window shows up. Here you can define the time interval you want to save and clickOK. TrackMate will generate a video of the experiment. - Remember to save the image from [File - Save as…].
Cool no?
Joanna W. Pylvänäinen - July 2021