The Gnu_Plot plugin provides the glue between ImageJ and Gnuplot. The main impetus for developing this plugin was that ImageJ is great at interrogating imaging data, Gnuplot is excellent at generating publishable plots, and I’m lazy. The trouble was in having to extract the plottable data, either from a ResultsTable or through a Java plugin, and then pasting into a ascii editor, save, run gnuplot from a terminal, display output image, and repeat. I prefer to just click a button after finding better plottable data or mucking with the Gnuplot script.
Features
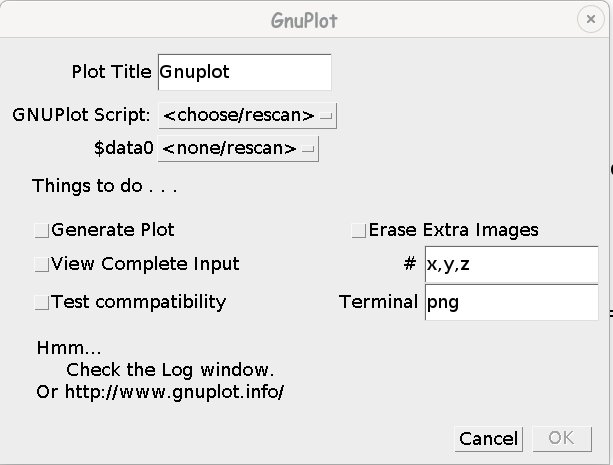
Gnu_Plot GUI
When run as a plugin Gnu_Plot will collect both the Gnuplot script and data and run this through the gnuplot executable as stdin, and read the image from stdout and display it in a ImagePlus window, and display any errors from stderr in the Log window.
Plot Title will be the title given to any script or image windows created.
Gnuplot Script is an Editor window that can be either, a fresh script, a script read from disk, or an existing Editor window.
$data# the inline/here document plottable datasets can be, unspecified, a PlotWindow, or, a ResultsTable. More that one dataset can be specified.
The Gnu_Plot window can be left opened and new scripts or datasets can be discovered for subsequent selection.
Generate Plot will collect the selected information, send it through gnuplot, and present the results. You can have all but the last generated plot image retained, if desired.
View Complete Input will collect the selected information and present it in an Editor window. Great to for debugging or saving if the output needs to be reproduced later and you will forget where the data came from exactly, like me; the input is a comment added to the script file.
Test compatibility will run a very simple Gnuplot script that should produce a graphical depiction of the options for the specified terminal; input will be placed after ‘set terminal ‘ in the script. Not all terminals are supported everywhere, and/or, you may not have gnuplot executable installed as this plugin expects, see the Log window.
Example
Let’s say you want to see the histogram of a phase image in polar format.
- Click List Button on the bottom of the Histogram window.
- Start the Gnu_Plot plugin.
- Select
<new>for the GNUPlot Script. - Copy/Paste this script into the Editor window.
set terminal pngcairo size 512,512 stats '$data0' using 3 name 'y' nooutput set polar set angles radians unset key unset xtics unset ytics set border 0 set size square set grid polar ls 12 set xrange [-y_max*1.1:y_max*1.1] set yrange [-y_max*1.1:y_max*1.1] set ttics ('-2π' -2*pi, '-π' -pi, 0, 'π' pi, '2π' 2*pi) plot "$data0" using 2:3 with linespoints - Select Histogram of … for $data0
- Click on Generate Plot
Methods
public static String gnuplot()
public static String gnuplot(String gp)
Identify the gnuplot executable, if needed.
public static ImagePlus process(String gps, String title)
public static boolean processAndDisplay(String gps, String title)
Generate plot from complete Gnuplot script.
public static String plotgs(String code, double[][]... arrs)
public static String plotgs(String code, float[][]... arrs)
Generate complete plot script. Each arrs pass(ed) in will generate a separate here-document data block.
public static ImagePlus plot(String title, String code, double[][]... arrs)
public static ImagePlus plot(String title, String code, float[][]... arrs)
Generate ImagePlus. Each arrs pass(ed) in will generate a separate here-document data block.
Coding Goodies
Generating data, running it through another executable, and using the output.
Dynamically updating Choice(s).
Install
Unzip Gnu_Plot.zip into ImageJ plugins File › Show Folder › Plugins or plugins/jars directories. Source code is in jar file.
Edit › Options › Gnu_Plot… Configure location of gnuplot executable.
Analyze › Tools › Gnu_Plot… Runs Gnu_Plot.
Licence
GPL distribution licence.
ChangeLog
1 April 2020 Initial version.
Known Bugs
Let me know.