The General Image Fiber Tool (GIFT) is an ImageJ macro tool which allows users to measure the average diameter of electrospun fibers in scanning electron microscopy (SEM) images. This work comes from the Institute for Biomedical Engineering at the University Medical Center Rostock. GIFT is freely available for download at GitHub.
GIFT is based on the work from the following 2 publications:
- Götz, V. Senz, W. Schmidt, J. Huling, N. Grabow, S. Illner, General image fiber tool: A concept for automated evaluation of fiber diameters in SEM images, Measurement 177 (2021) 109265. https://doi.org/10.1016/j.measurement.2021.109265.
- Huling J, Götz A, Grabow N, Illner S (2022) GIFT: An ImageJ macro for automated fiber diameter quantification. PLoS ONE 17(10): e0275528. https://doi.org/10.1371/journal.pone.0275528
Full instructions for installation and use are available for download at the GitHub page in the Use Manual. The User Manual also includes examples and troubleshooting tips. Example images are also available for download. A brief explanation and introduction is provided on this page.
The GIFT Method
Briefly, the 8-bit image is processed with a Sobel operator to identify the edges, followed by thresholding to create a binary image containing the fiber edges. The threshold range is determined based on a given percent of included pixels. This binarized image is then rotated to create a set of rotated copies. The separate ImageJ plug-in, MorphoLibJ, is used to apply a horizontal opening line filter. This step isolates line segments that are roughly horizontal at each rotation angle. In doing this, the parallel edges of any fiber segments running horizontally will be preserved after the filtering step. Then, in each image of the rotated set, the macro scans through each pixel column and identifies the maxima, which correspond to the locations of edges in the original image. The vertical pixel distances between maxima are measured and converted into a real distance based on the scaling factor. This creates a large raw data set of measured distances between edges in the image. Some of these distances represent the distance between the two edges of one fiber (fiber diameter) and some represented the distance between edges of neighboring fibers (background). Because the fiber diameter is relatively constant, it should appear with a significantly higher frequency in this data set, while the background distances have a more random distribution. To identify the fiber diameter, a histogram is plotted of all of the distance measurements and fitted using a Gaussian model. The peak location of the Gaussian fit represents the mean fiber diameter and the peak width represents the standard deviation.
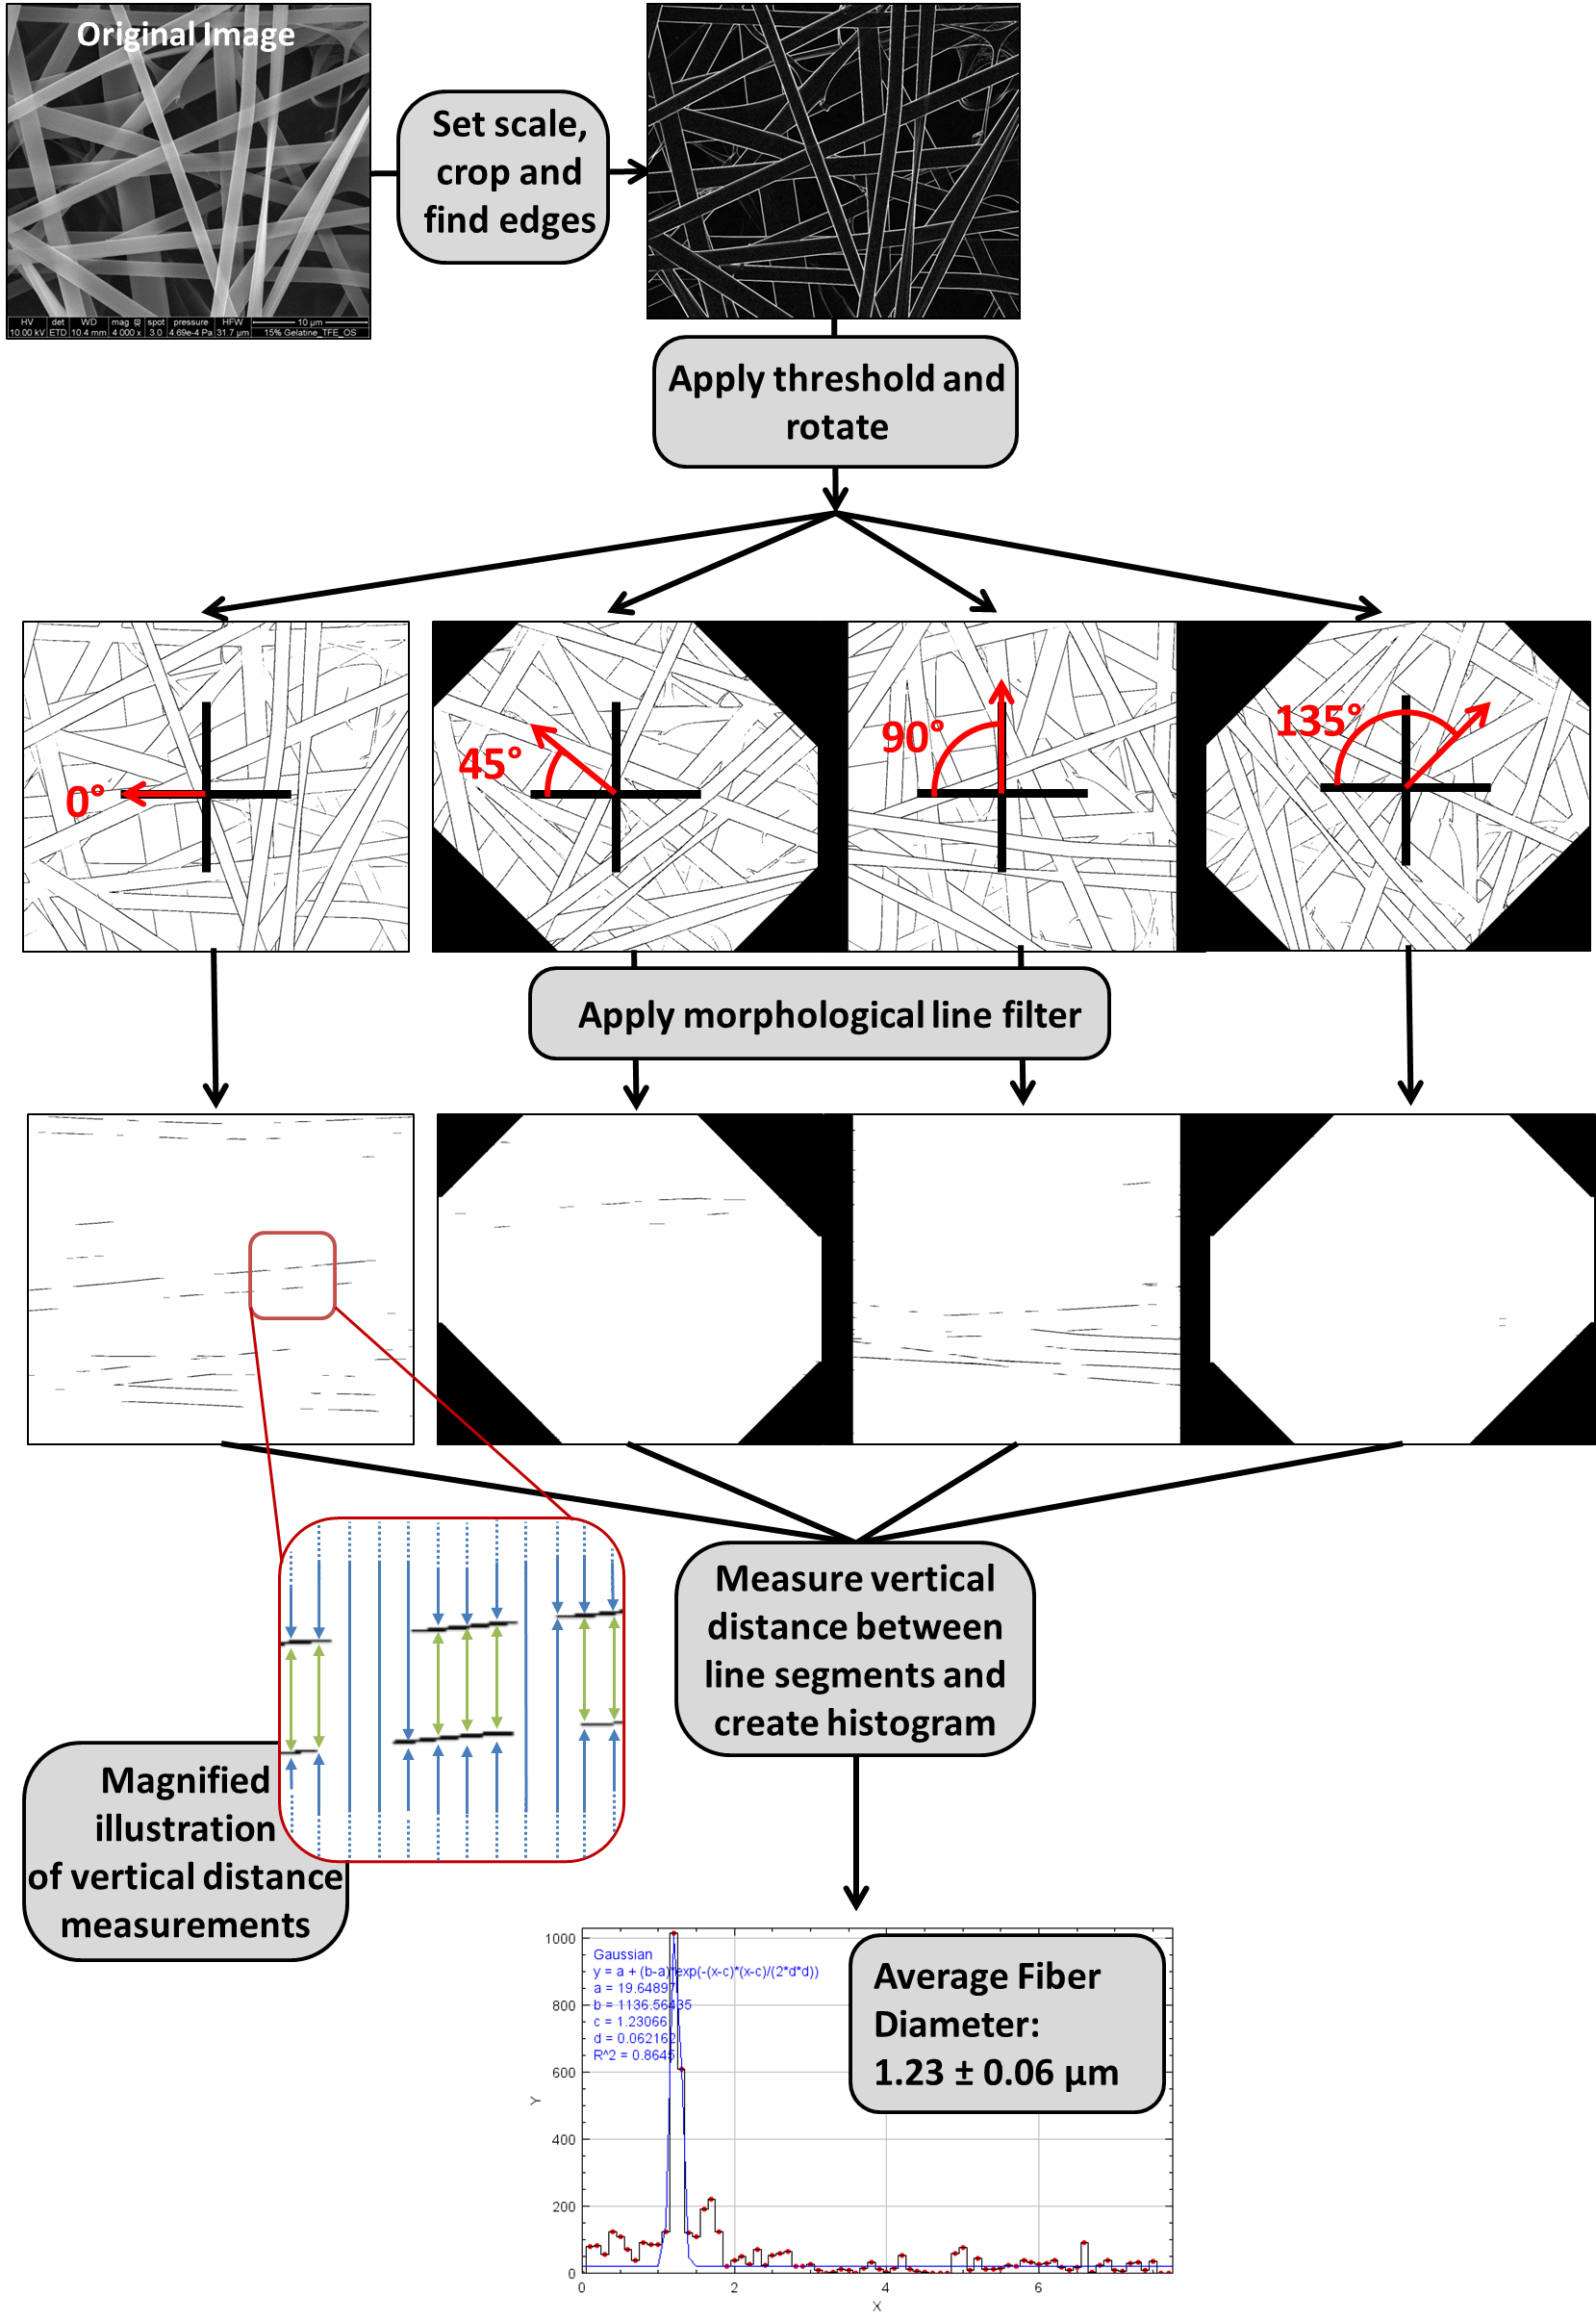
The above diagram shows a real world example of what the GIFT method looks like when applied to a single image. First the image is prepared by measuring the scale and then cropping off the information at the bottom of the image. A Sobel operator is applied to detect the edges in the. Then the image is thresholded and rotated, resulting in a set of thresholded images at various angles of rotation. Each of these rotated images goes through morphological opening filtering based on a horizontal line element. Then every pixel column in each filtered image is scanned for black pixels. The vertical distances between the black pixels (which correspond to edges in the original image) are measured. This process is illustrated in the inset image, where the green arrows highlight high frequency distance measurements that occur due to fibers. All measurements from the rotated image set are pooled together. These measurements are graphed as a histogram and a Gaussian fit is used to find the peak.
User Interface and Parameter Controls
When the GIFT macro icon is selected, there are two options: “Process Single Open Image” and “Batch Process”. Both run the exact same method and will generate the same results. The single image mode can be useful when first evaluating the parameters best suited for an image set, however the focus of development was the batch processing mode.
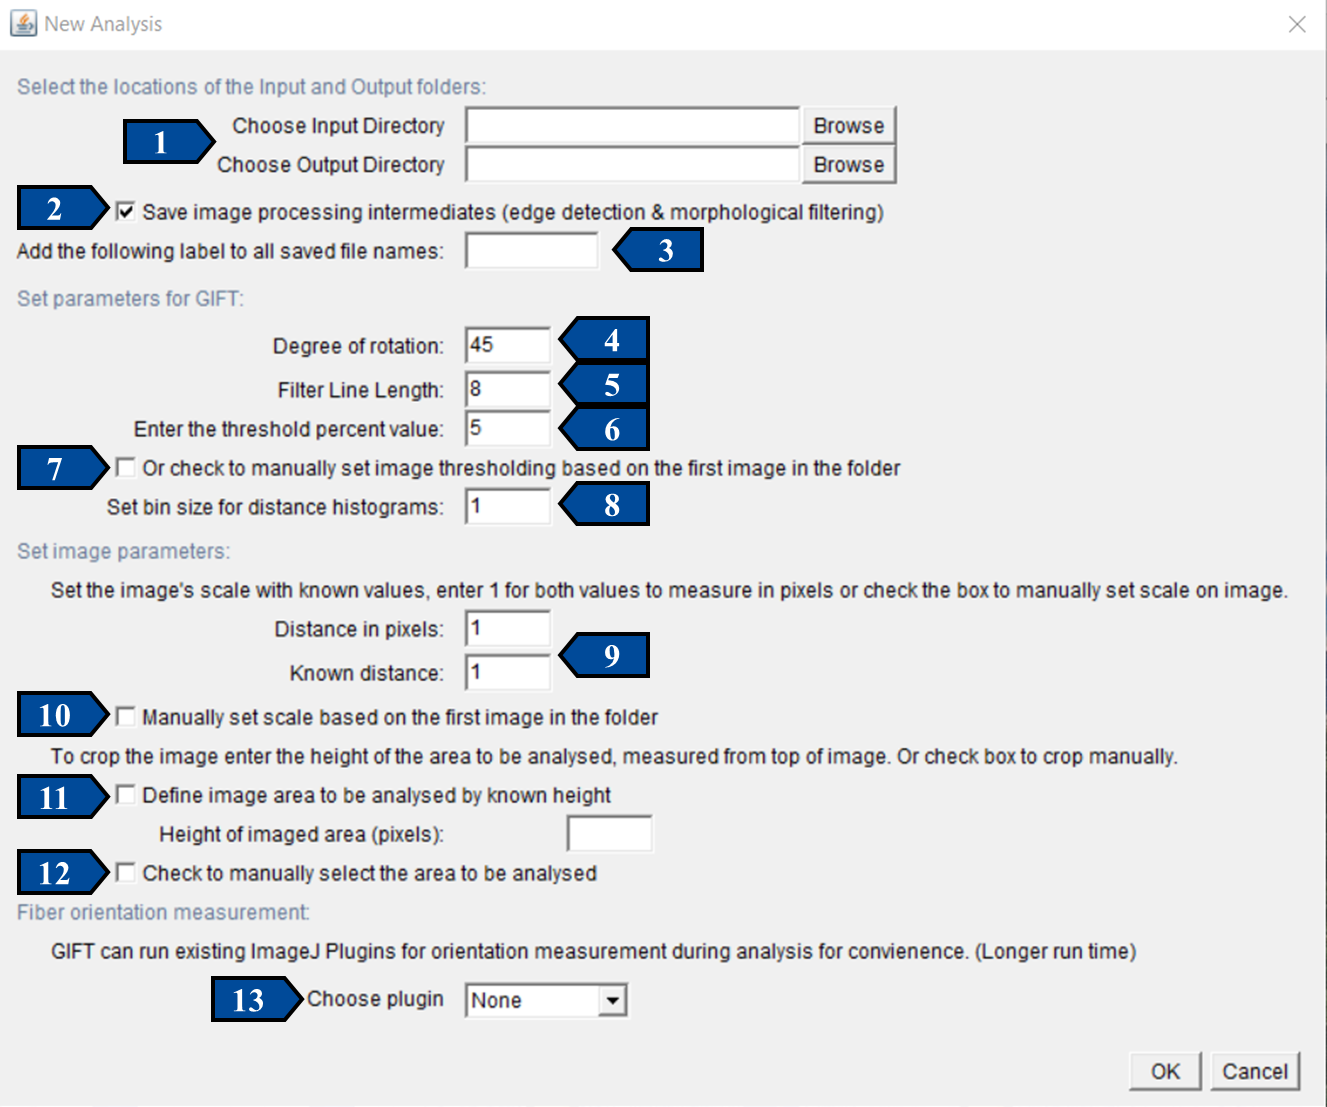
The GIFT macro was designed so that users could get started easily, with a very small learning curve. When running the batch mode of GIFT, the only required user inputs are the Input and Output directories. All other necessary parameters are assigned default values so the program can be run without further input and the default image processing values are based on the results from Götz et al, 2021. The image below shows the graphic user interface for batch processing using GIFT. The 9 user-adjustable parameters are indicated with arrows. The figure shows how the interface appears when first opened, with default values selected.
GIFT Results and Output
As part of GIFT, a histogram of distances is generated for each image. A Gaussian fit of this histogram is what is used to quantify the fiber diameter and standard deviation. The histogram and Gaussian fit line are plotted together and for each image the resulting graph is saved in two forms which both appear in the selected output folder. A summary table with the title “Results” will be created and displayed after running the GIFT macro. This table contains a row for each image processed and columns containing the mean fiber diameter, standard deviation (SDEV) of the fiber diameter, and the R2 value for the Gaussian fit and the number of observation made (total number of distances measured) for each image. The Results table can be saved as .txt, .csv or .xls file in the output folder at the end of the analysis process (saved under name “BatchResults”). Every time GIFT is run, it generates several tables containing completes sets of data, in addition to the summary data in the Results table. The macro will always generate a CompleteDataFile table and a CompleteFrequencyFile table. The CompleteDataFile table contains the raw data used to create the distance histogram. There will be one column per image analyzed and the column contains every vertical distance measurement made. This raw data set is what is used to create the distance histogram and is available so that users could choose to make their own histogram, with complete control over the data analysis parameters. The CompleteFrequencyFile table has the data pertaining to the distance histogram and Gaussian fit. The first column, called “distance”, corresponds to the histogram bins and is given in the units specified at the beginning of the analysis. Each analyzed image will have 2 columns of data in the table. The first lists the frequency which corresponds with each bin and the second column gives the values of Gaussian fit curve at each bin value. These values can be used to directly recreate the histogram and fit curve that the GIFT macro creates for each graph.
Other Plugin Dependencies
GIFT requires other freely available ImageJ plugins to function. At minimum, GIFT requires the installation of the plugin MorphoLibJ. All information, installation instructions and files for MorphoLibJ can be found here https://github.com/ijpb/MorphoLibJ. The newest version of MorphoLibJ should be installed in ImageJ before running GIFT. To install in Fiji, use the Updater. Go to Help>Update… in the Fiji menu. Select Manage Update sites, and then check the box next to IJPB-plugins and hit close. Click Apply changes and restart Fiji. GIFT can run two fiber orientation plugins to collect orientation data along with measuring fiber diameters (OrientationJ and Directionality). This is optional and if the user does not want to measure fiber orientation, then these plugins do not need to be downloaded or just one can be added. Information about OrientationJ can be found here: https://bigwww.epfl.ch/demo/orientation/ (OrientationJ_.jar available for download directly at this website under the Download section on the lefthand side). Information about Directionality can be found here: https://imagej.net/plugins/directionality. It is recommended that Fiji is used to access Directionality as it is already included as part of Fiji and requires no further action to install.