SNT: Analysis
| Home | Manual | Walk-throughs | Screencasts | Shortcuts | Rec. Viewer | Analysis | Scripting | Modeling | FAQ |
Contents
Sholl Analysis
There are two Sholl Analysis commands available in SNT's Analysis menu. The Analysis › Shuoll Analysis... option provides a set of pre-defined focal points the user can choose from. Note for the morphology-based focal points (e.g., Soma, Root node(s): Primary apical dendrite(s)) , the relevant morphology tag(s) must be assigned to the set of paths considered by the analysis. To select a focal point manually, see the following section.
Sholl Analysis (by Focal Point)
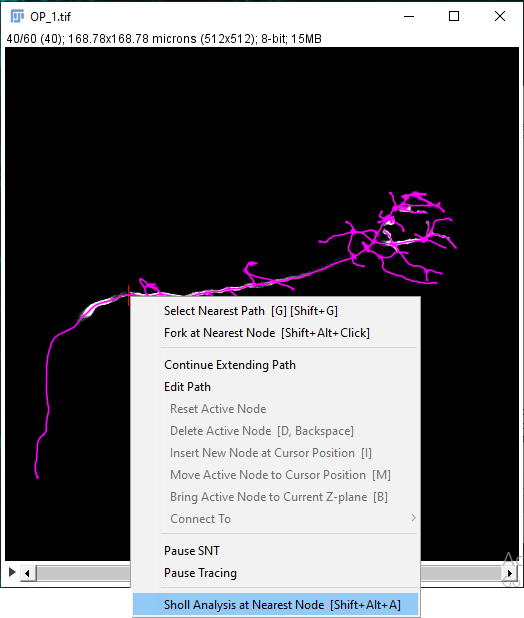
It is also possible to initiate Sholl Analysis on a tracing in the canvas by manually selecting a focal point. You can do it coarsely by right-clicking near a node and choosing Sholl Analysis at Nearest Node from the contextual menu (Shortcut: ⎇ Alt + ⇧ Shift + A.
Alternatively, for precise positioning of the center of analysis:
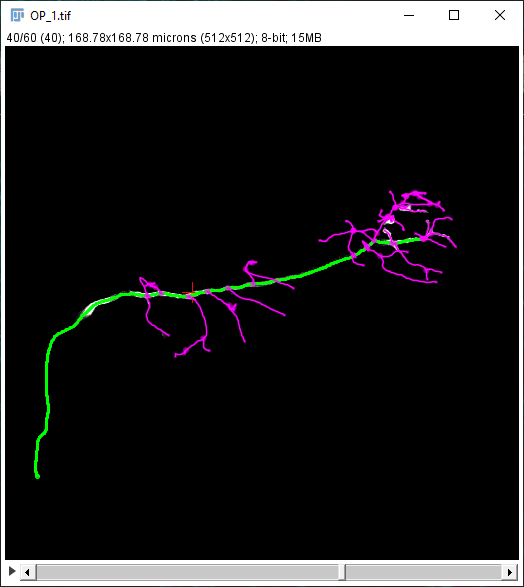
- Mouse over the path of interest. Press G to activate it.
- Press ⎇ Alt+⇧ Shift to select a node along the path.
- Press ⎇ Alt+⇧ Shift+A to start analysis.
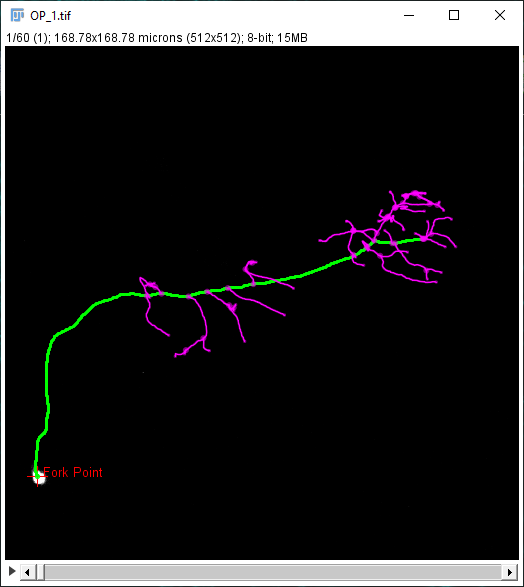
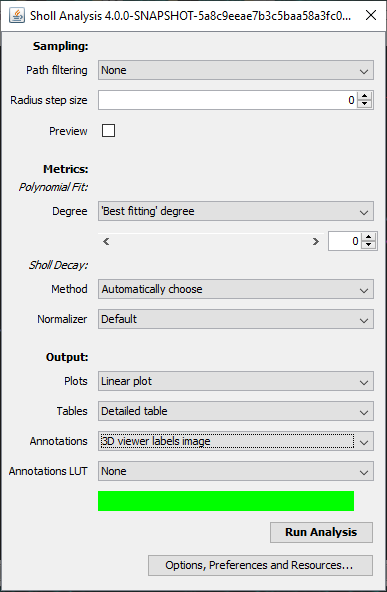
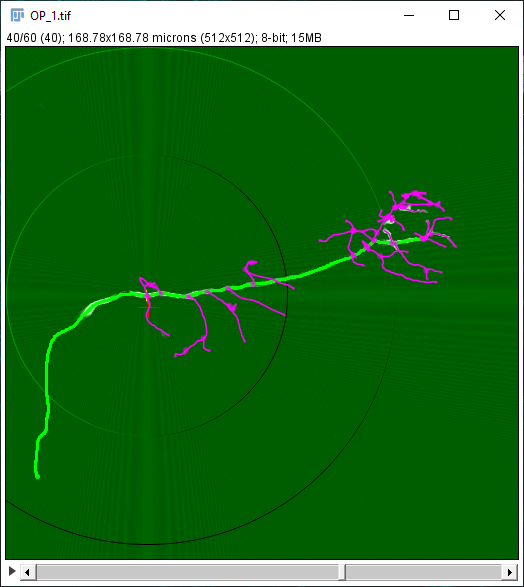
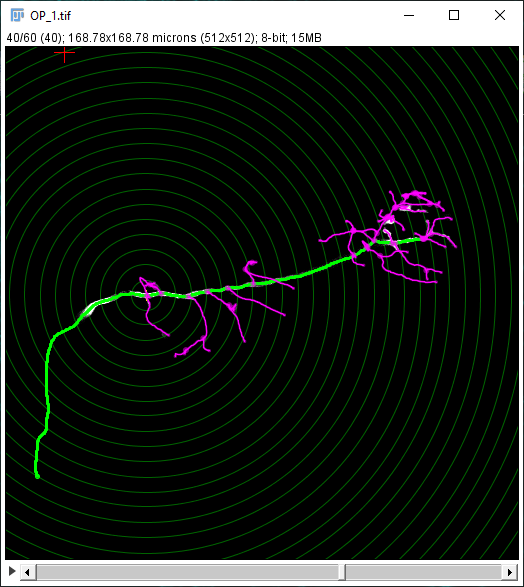
The Sholl dialog created by this approach differs slightly from the dialog created by running the Analyze › Sholl › Sholl Analysis (From Tracings)... plugin in the main Fiji menu. First, the center of analysis is automatically taken from the nearest (or exact) node where the user clicks. In addition to morphology and custom tag filters, the Path filtering drop-down menu provides an additional option to restrict the analysis to the subset of paths selected in the Path Manager. Another advantage is that the display canvas allows the radius step size to be previewed visually. To do this, toggle on the Preview checkbox under the Sampling section and experiment with different step sizes.
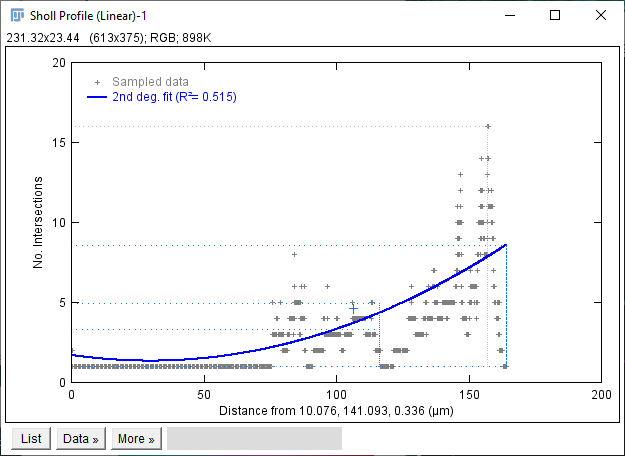
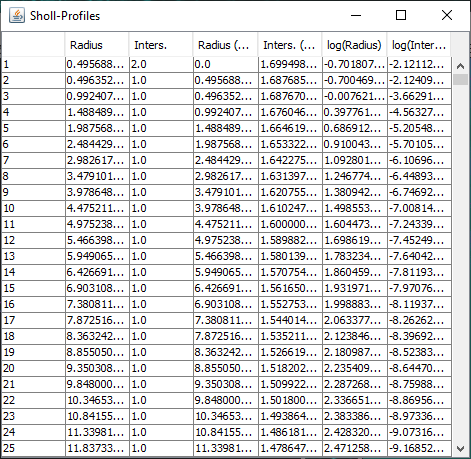
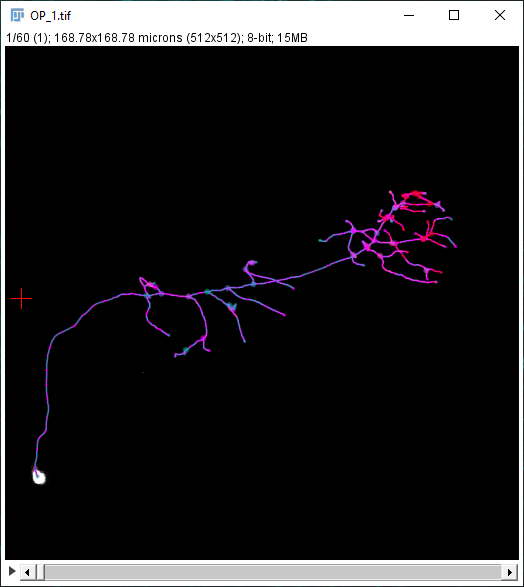
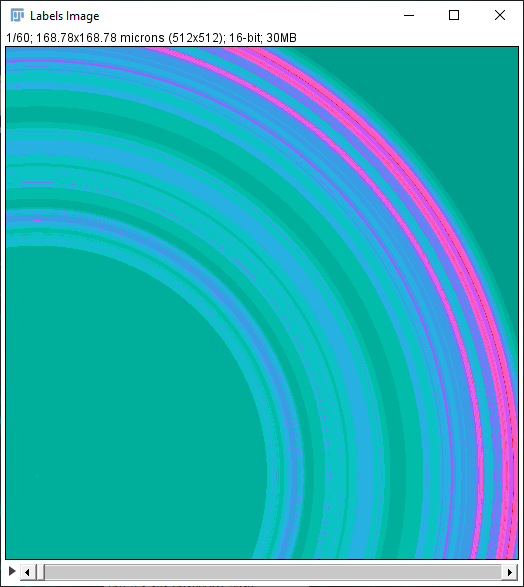
In addition to the Sholl Profile plot and table, the output of the analysis can be visualized as a color mapping of the reconstruction and as a Sholl Image. To color code the tracing, choose Color coded paths from the Annotations drop-down menu and select a Lut from the Annotations Lut drop-down menu before pressing Run Analysis. To output the Sholl Image, choose 3D viewer labels image from the Annotations drop-down menu and select the desired Lut before running the analysis.
Strahler Analysis
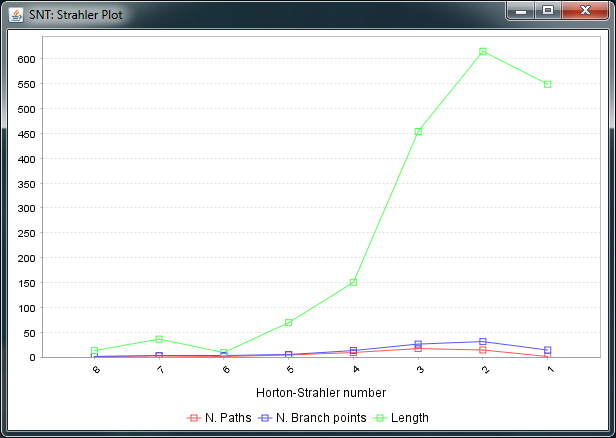
To conduct Strahler Analysis on the current contents of the Path Manager, choose the Utilities › Strahler Analysis command in the main SNT dialog. This command will output the results of the analysis as a table and plot. These figures contain morphometric statistics on the group of paths associated with each Horton-Strahler Number. Note that this feature analyzes traced reconstructions. To run Strahler analysis on images, use the Analyze › Skeleton › Strahler Analysis... plugin in the main Fiji dialog.
Path Order Analysis
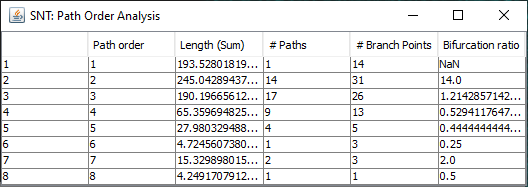
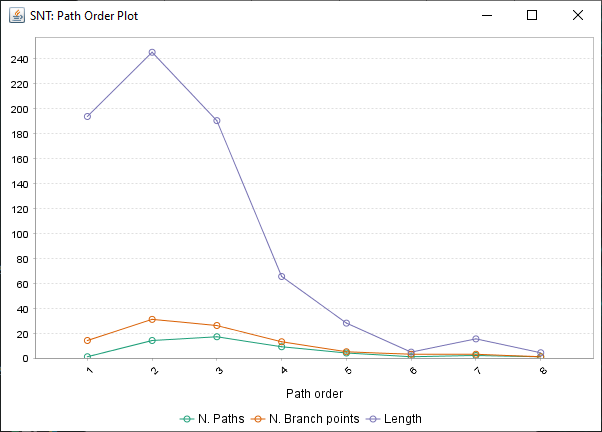
Found at Analysis › Path Order Analysis in the main SNT dialog, this option analyzes the Paths in the Path Manager based on Branch Order. Produces a table of results and a plot similar to the Strahler Analysis option, with morphometric statistics on the group of paths associated with each Branch Order.
Measurements
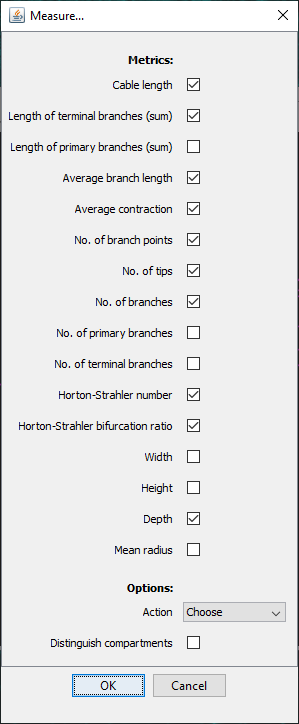
SNT provides several ways to measure reconstructions. A comprehensive selection of measurements can be found by going to Analysis › Measure.... in the main SNT dialog. Note that for this option, if multiple rooted tree structures exist in the Path Manger, you will be prompted to choose one for analysis.
To quickly measure all existing paths with a common set of statistics, choose Analysis › Quick Measurements. In both cases the results of the measurements are displayed in a table.
To get measurements only on a select group of Paths, first select or filter for the Paths you want to measure in the Path Manager, then choose either command from the Analyze menu in the Path Manager.
Batch measurements of reconstructions can be accomplished via scripting. See Measure_Multiple_Files.py in the SNT Script Templates for a basic example.
Dendrogram Viewer
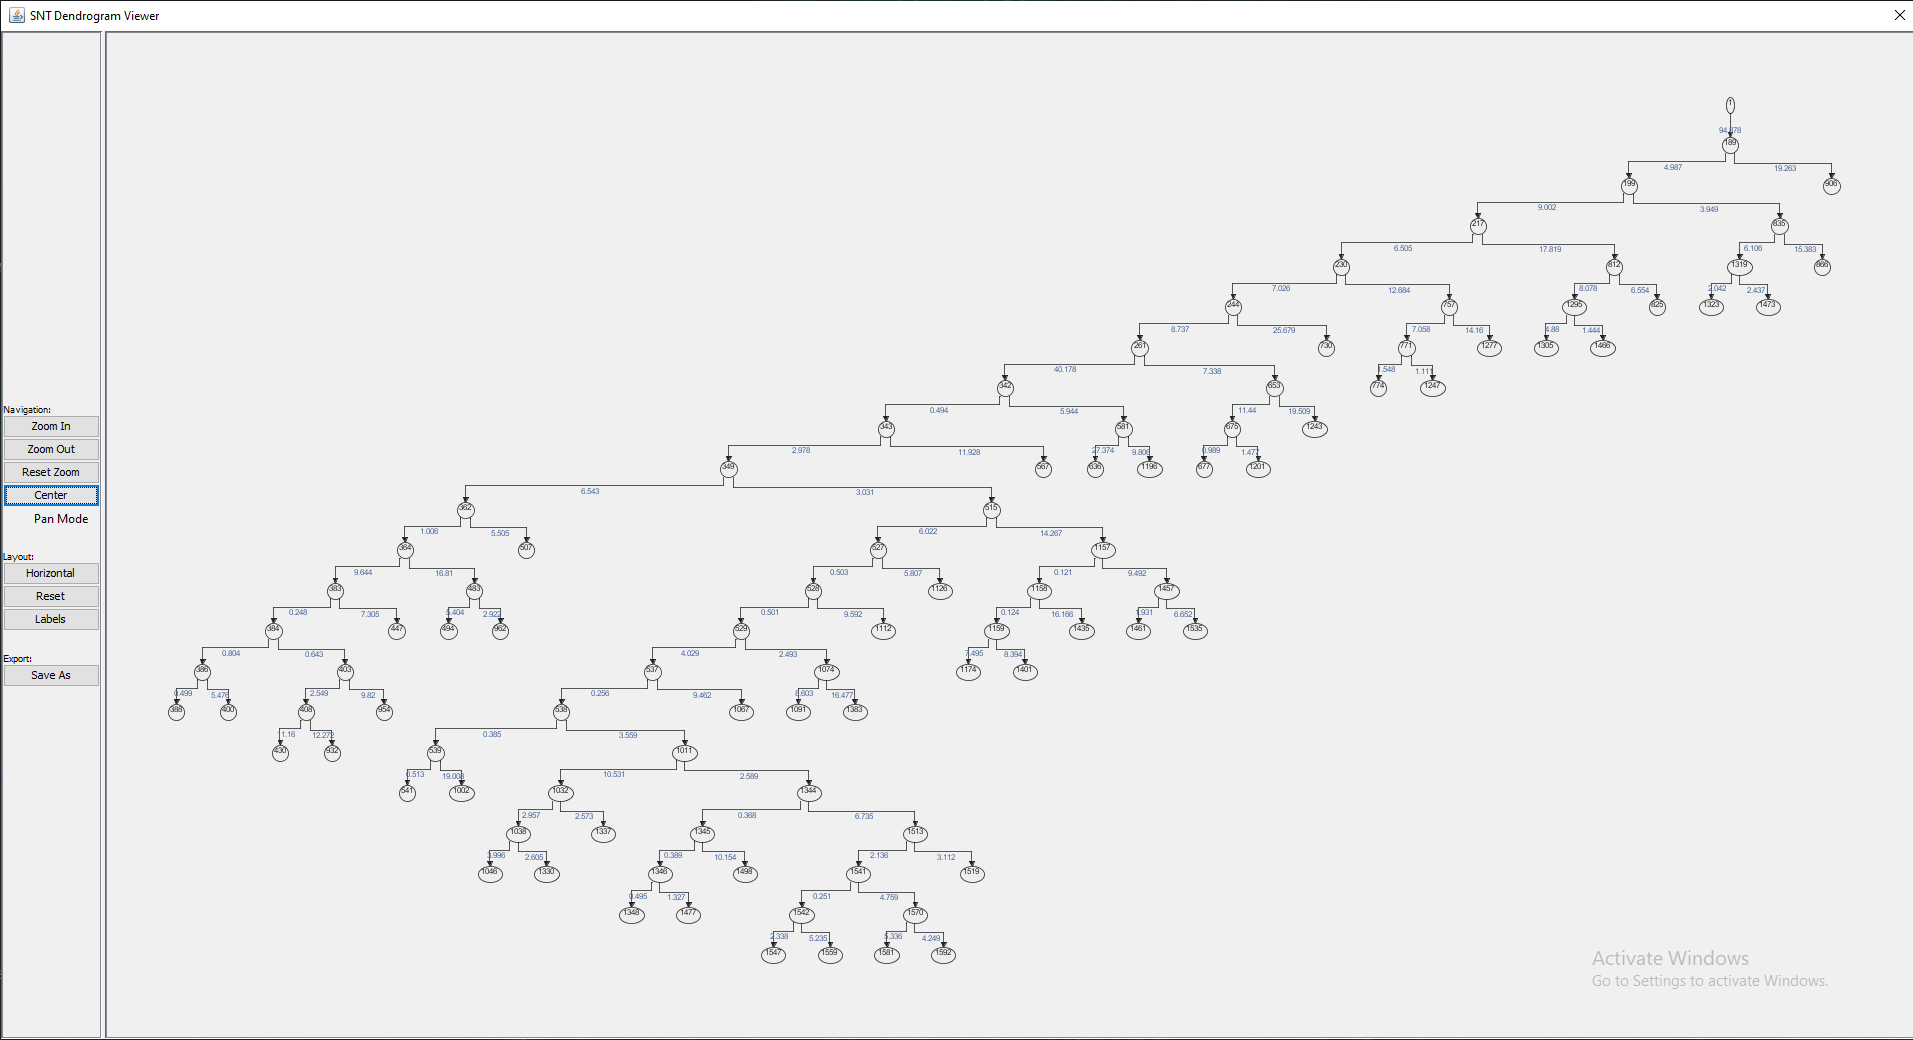
Found at Utilities › Create Dendrogram, this option generates a Dendrogram from one connected component (i.e., a single rooted tree structure) in the Path Manager, providing a high-level overview of neurite branching topology. Note that if multiple rooted trees exist in the Path Manager, you will be prompted to choose one of them.
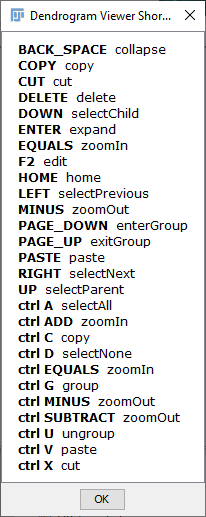
The viewer provides controls for orientation, zoom level, panning, vertex editing and traversal as well as options to display vertex labels and edge weights (which by default are the euclidean distances between adjacent vertices). To see the available key shortcuts, right click on the viewer and choose Available Shortcuts.... The plot may be exported in several file formats, including HTML, PNG and SVG.
Fine-grained programmatic control over SNT's Graph objects is achieved using the JGraphT API in a script. Also relevant is the sc.fiji.snt.analysis.graph package which provides high-level tools for Graph creation and conversion. See Graph_Analysis.py in the SNT Script Templates for a basic example.
Comparing Reconstructions
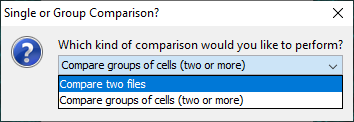
The Utilities › Compare Reconstructions... command will bring up a prompt which gives the user the option to compare two single reconstruction files against multiple metrics, or multiple groups of reconstruction files against a single metric.
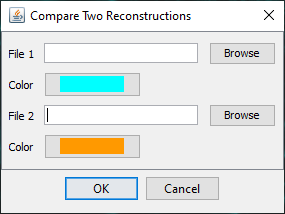
If you select, Compare two files and press OK, a file chooser dialog will appear allowing the user to select two SWC files and their respective colors for display in Reconstruction Viewer.
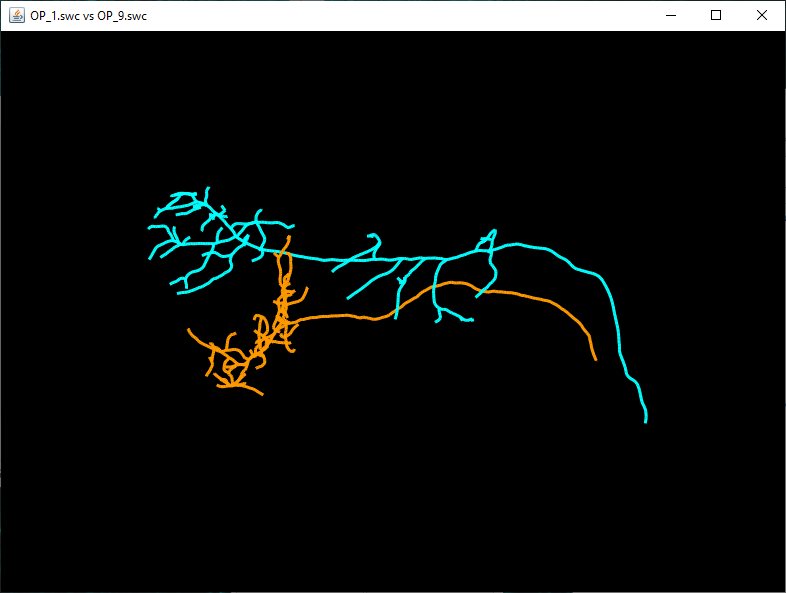
Use the Browse button to select the two files and press 'OK' to run the analysis. The results will include a table containing results of the Quick Measurements function for both reconstructions, as well as an instance of the 3D Reconstruction Viewer displaying both reconstructions.
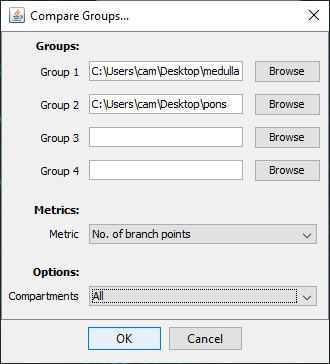
To instead compare multiple groups of reconstruction files against a single metric, choose Compare groups of cells (two or more) in the initial prompt.
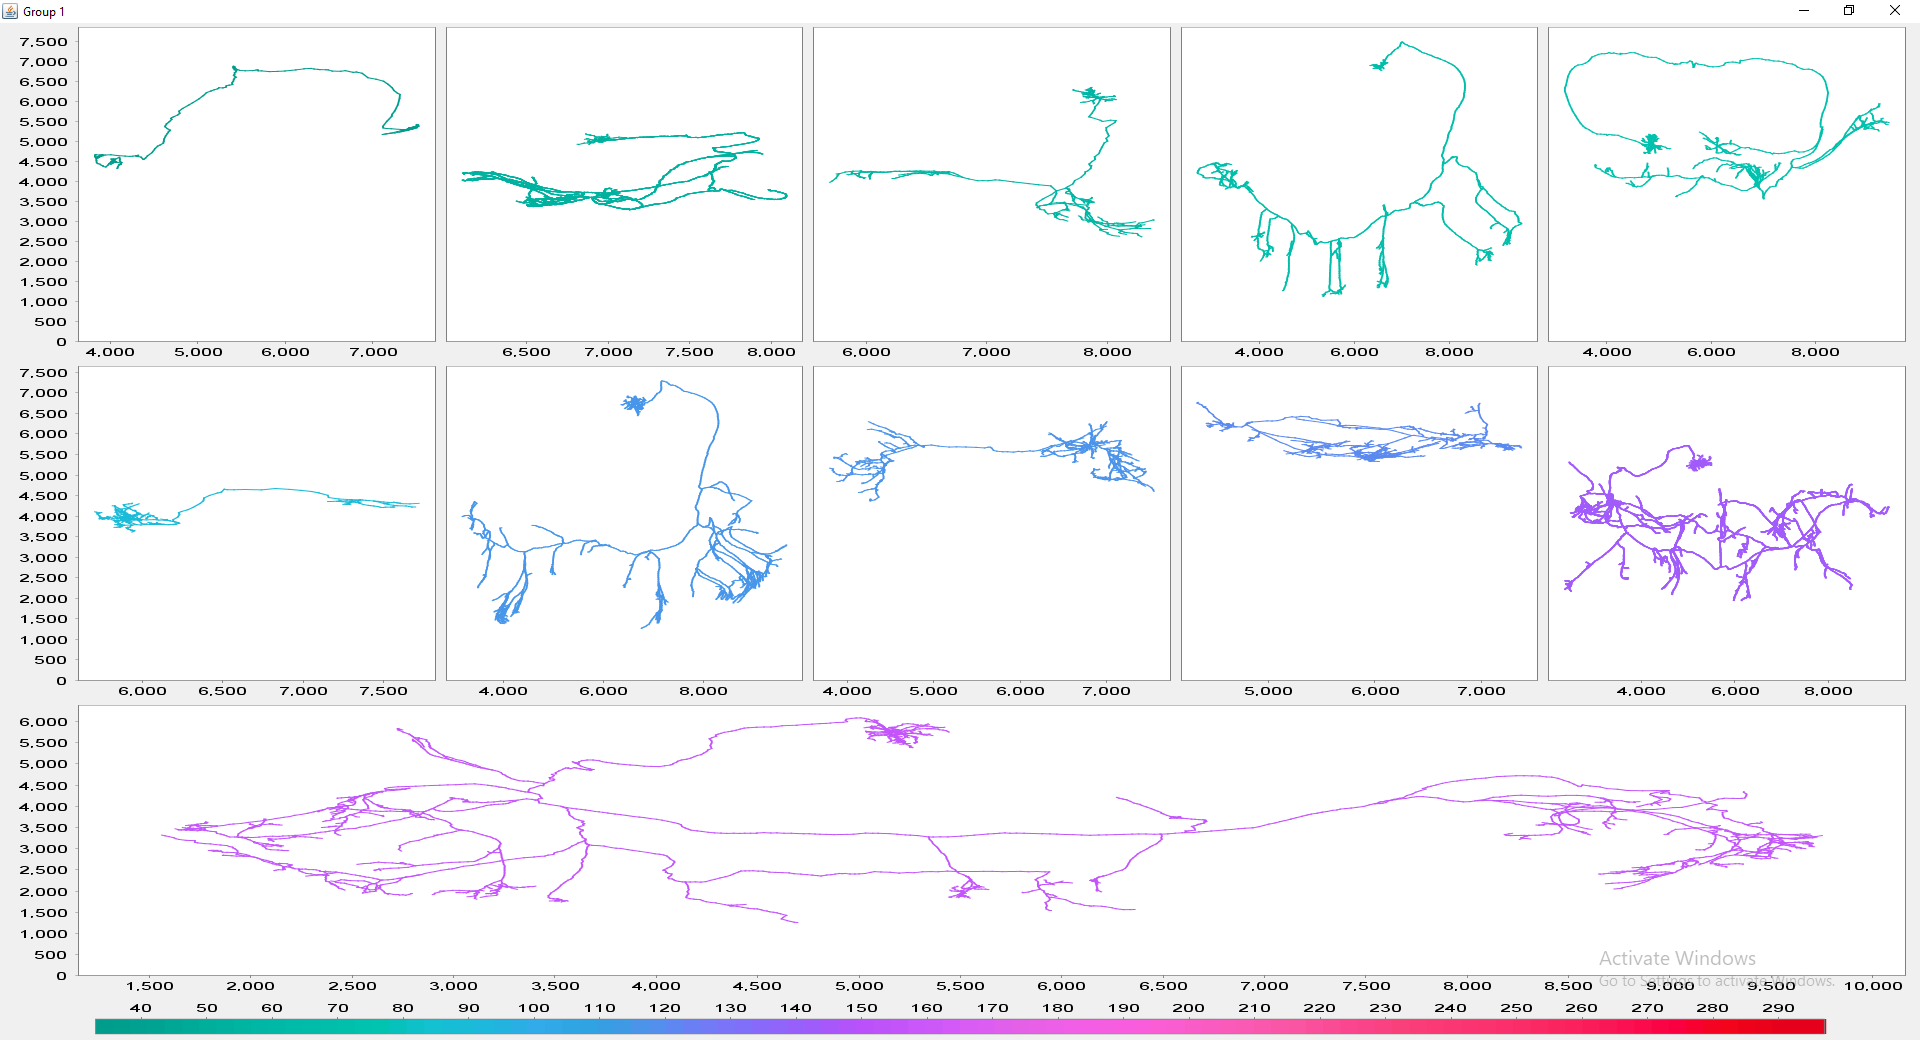
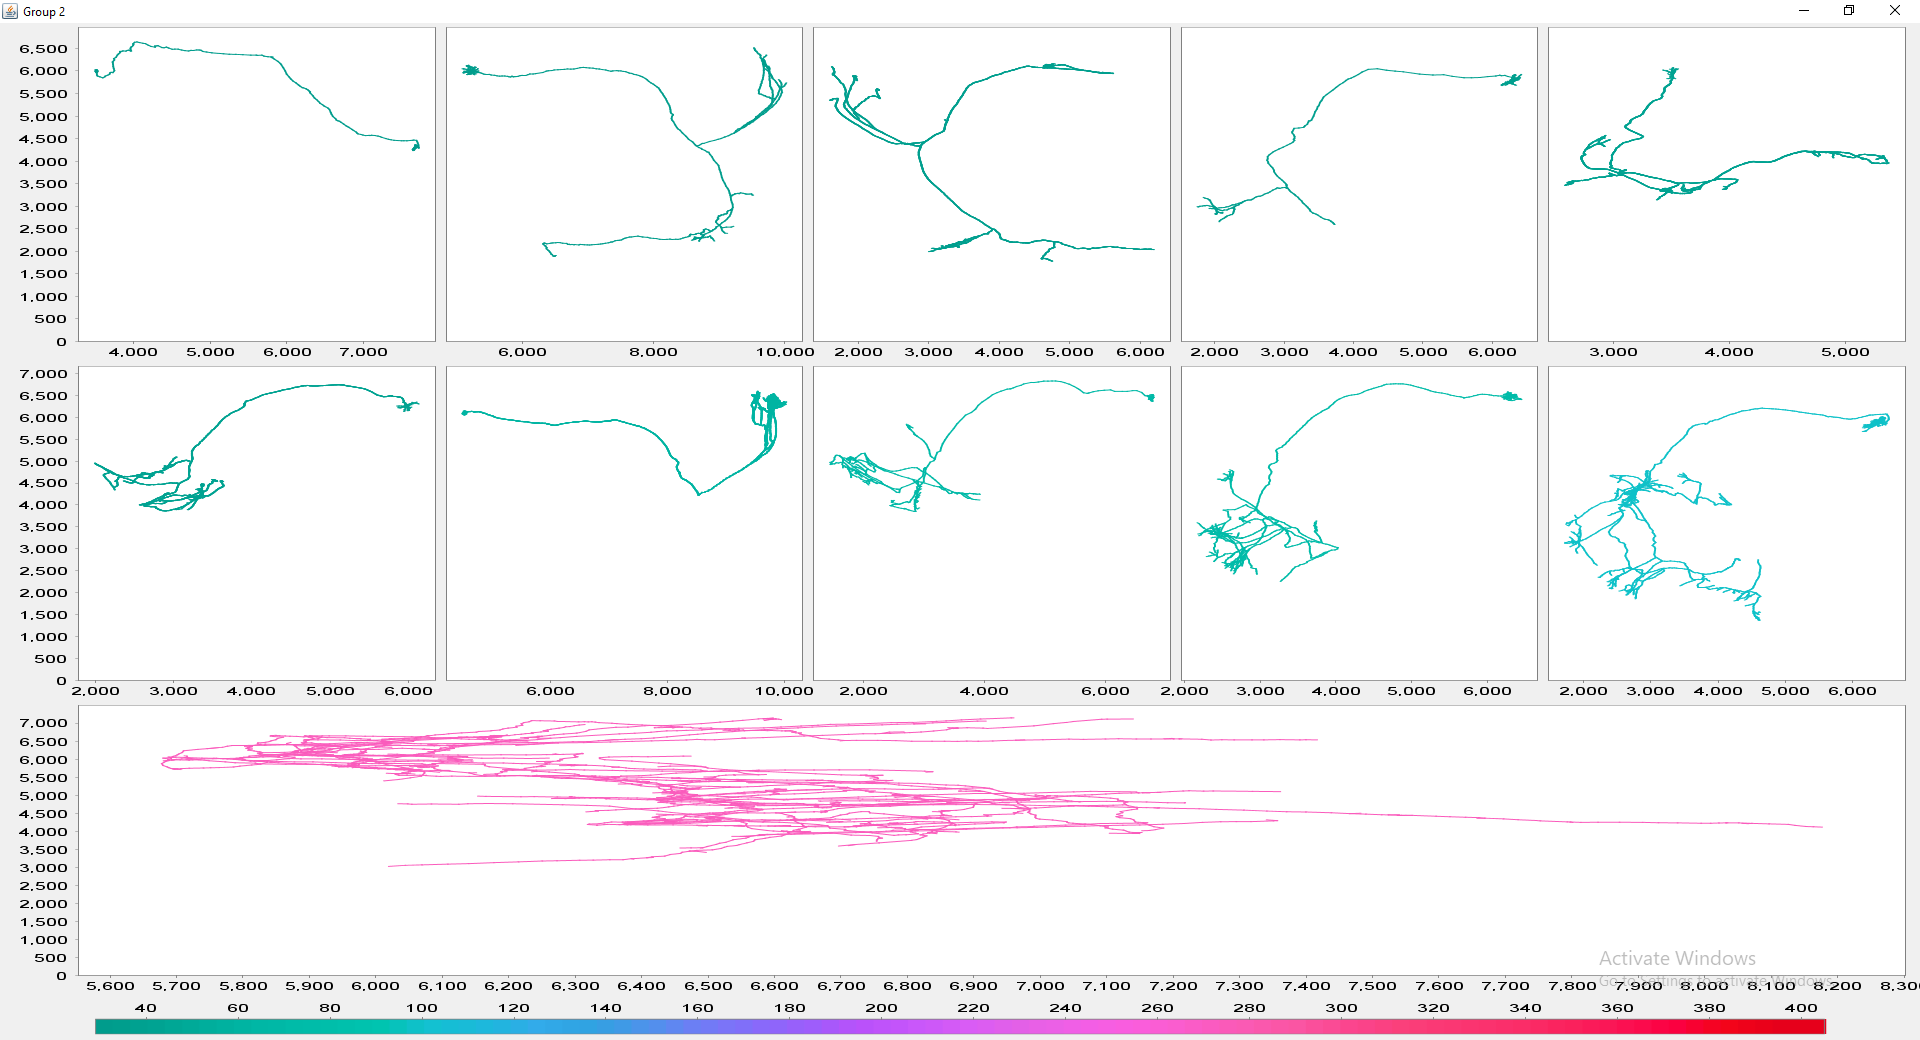
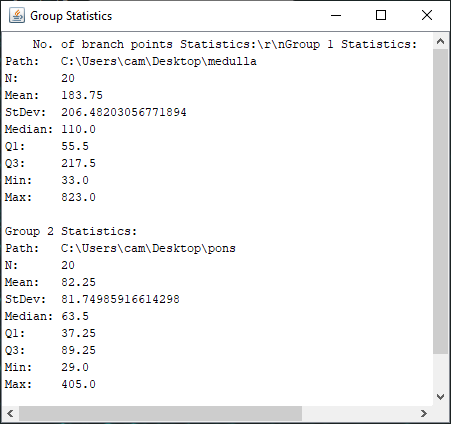
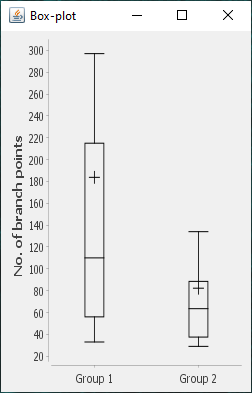
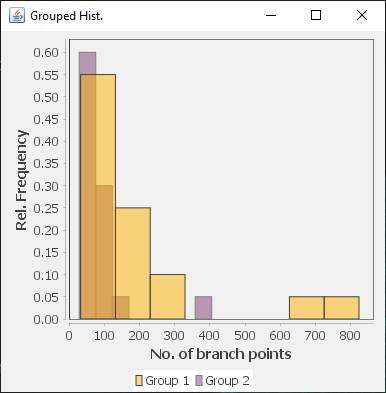
The file selection prompt for this option allows selection of up to four directories containing SWC files. The metric to compare against is chosen from the Metric drop-down menu. Optionally, the user may restrict the analysis to specific neurite compartments. After making your selections, press OK to run the analysis. The result include multi-panel figure(s) rendering up to ten reconstructions from each group, a window with the metric statistics on each group, a box-plot and a histogram. These figures can all be exported as PNG or SVG.
Custom Analyses
It is possible to script your own analysis routines. See SNT:_Scripting for the link to SNT's API as well as script templates demonstrating a range of analysis possibilities.
| Home | Manual | Walk-throughs | Screencasts | Shortcuts | Rec. Viewer | Analysis | Scripting | Modeling | FAQ |
