File:ErrorAnalysis.png
Analysis of the registration error
(a) shows the stability of minimal, average and maximal registration error of all registered views in a time-lapse acquisition. (b) shows a histogram of the remaining displacement between all true corre- sponding bead pairs after the global optimization. (c) shows histograms of the remaining displacement between all true corresponding bead pairs in coordinates of the individual original views (i.e. the final global coordinates from the optimization were transformed back into the coordinate systems of the in- dividual views). The three histograms show the error distribution separately for each dimension. The x-dimension is parallel to the rotation axis and therefore shows the lowest error while the z-dimension shows the highest error reflecting less accurate localization of the beads in the axial direction. The y -dimension shows intermediate error variation because it is angle-dependent. (d) shows the depen- dence of the error variance on the angular difference between the views. Note that the angle dependent error changes mainly in the y -dimension; the smaller the angle difference the lower the average dis- placement.
File history
Click on a date/time to view the file as it appeared at that time.
| Date/Time | Thumbnail | Dimensions | User | Comment | |
|---|---|---|---|---|---|
| current | 11:36, 27 May 2010 | 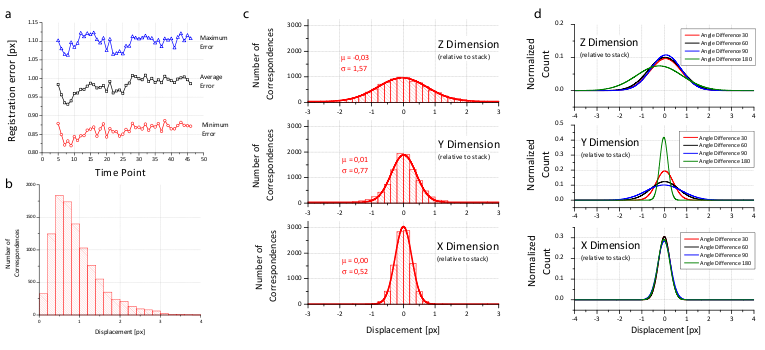 | 765 × 350 (92 KB) | Axtimwalde (talk | contribs) | Analysis of the registration error (a) shows the stability of minimal, average and maximal registration error of all registered views in a time-lapse acquisition. (b) shows a histogram of the remaining displacement between all true corre- sponding bead p |
- You cannot overwrite this file.
File usage
The following page links to this file: